SaaS Heatmap: How to Read One Across Your Whole Site
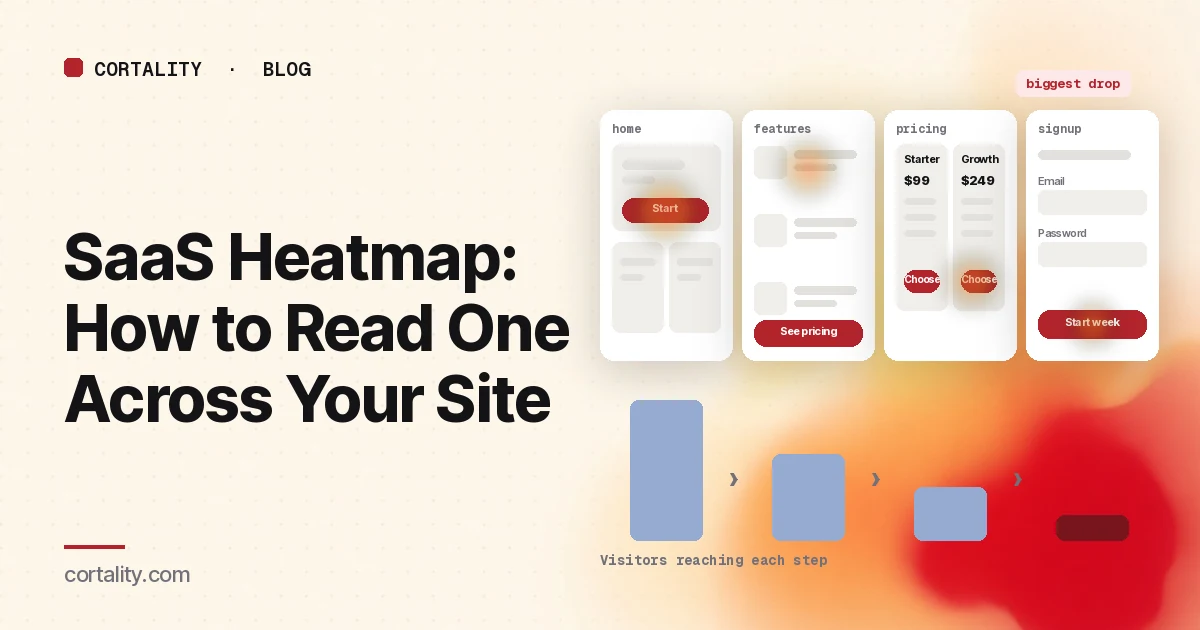
Most SaaS teams install a heatmap, open the homepage, look at a lot of red around the menu, and close the tab. The homepage is the easiest map to open and often the least useful one. Buyers move through your site in steps, from a homepage or ad to a features page, pricing, and then a signup or demo request, and each step loses some of them. A SaaS heatmap earns its keep when you read it step by step and spend your time on the step that loses the most people.
This is the hub for that reading. For the store-side counterpart, see our ecommerce heatmap guide. If you're new to the maps themselves, how to read a website heatmap covers the basics.
What a SaaS heatmap shows
A heatmap adds up behavior from many visits onto one screenshot of a page. Microsoft Clarity, a free analytics tool from Microsoft, offers five kinds (Microsoft Clarity, Heatmaps overview):
- Click maps show where visitors click or tap, including on things that aren't links. Clarity can filter them to dead clicks (no response), rage clicks (fast repeated clicks in one spot), error clicks (right before a JavaScript error), first clicks and last clicks (Microsoft Clarity, Click maps).
- Scroll maps show the share of visitors who reach each point of the page, and mark the average fold: how much of the page people see before they start scrolling (Microsoft Clarity, Scroll maps).
- Area maps add up the clicks inside a region you select, which is useful for a plan column or a cluster of feature blocks.
- Attention maps show how long visitors spend on each part of the page.
- Conversion maps show, for an area of the page, the share of sessions that ended in a purchase after a click there. Clarity only offers them on projects where it detects purchase events (Microsoft Clarity, Conversion maps). Many SaaS sites won't see this map unless they also sell a paid checkout. For trial or demo goals, use your own signup or lead events instead.
A heatmap shows what happened on one page. It does not show how many people moved to the next step, or whether a click led to a trial. Pair it with events in your analytics, and with a few session recordings when the map is surprising.
Set it up by page type, not by URL
A SaaS site has a handful of templates and a long tail of URLs (blog posts, docs, individual feature pages). Set up your reading around the templates that sit on the path to a trial or a demo.
- Group pages that share a template. Feature pages often share a hero, a block list and a button. Blog posts share a header, a body and an end-of-post call to action. Clarity lets you add several URL filters to view one heatmap for a group of pages (Microsoft Clarity, Click maps). Read the group to judge the template, then your busiest page of each type on its own to judge its content.
- Split by device. Feature grids stack into one long column on a phone, plan tables often turn into stacked cards, and signup forms get taller. Read desktop and mobile separately; our guide to mobile vs desktop heatmaps explains why the maps differ.
- Split big traffic sources. Someone who landed from an ad for one feature is not the same visitor as someone who clicked Features in your menu. If ads, email or docs send a large share of people straight to one page, read that segment on its own.
- Track the steps as events. A heatmap shows behavior on one page. To see how many people move from one step to the next, you need events in your analytics. Google Analytics 4's recommended events include sign_up and generate_lead (Google Analytics, Recommended events). Enhanced measurement can also send form_start and form_submit when someone begins or submits a form, and a scroll event the first time a visitor reaches 90% of a page (Google Analytics, Enhanced measurement events). Check which of these actually arrive.
- Use a fixed window. Aim for a few hundred page views per device for each page type, and keep the window the same length when you compare before and after a change. If your traffic is small, heatmaps on a low-traffic website covers what you can still read.
Find the step that loses the most visitors
Before you open any heatmap, write down what share of visitors move from each step to the next over the same window:
- Visits that reach the homepage, or the campaign landing page your ads use
- Homepage or landing visits that lead to a features or product page
- Features or product views that lead to pricing
- Pricing views that lead to a started signup or demo request
- Started signups or demo forms that lead to a completed trial or booking
Some loss at every step is normal. Many visitors are comparing tools, collecting tabs or aren't ready to start a trial. Don't compare your numbers against a perfect funnel. Compare them against each other and against your own past weeks, and read the heatmap for the step that dropped or that loses the most people. A SaaS website conversion audit is a useful companion when you want a page-by-page checklist alongside the maps.
Read the site step by step
1. Homepage: do visitors find a way in?
The homepage's job is to send the right visitors to features, pricing or signup, and to answer what the product is before they leave. On its click map, sort the top clicked elements into the menu, the main button, product screenshots, feature shortcuts, and things that aren't links. Then check the scroll map: if the proof or the second call to action sits far below the average fold on mobile, most phone visitors never see it.
Main signal: where clicks go after the hero, and how many visitors scroll past the first screen. Heavy clicks on the menu can mean people didn't find what they wanted in the hero. The homepage heatmap guide covers the patterns, and SaaS homepage best practices has the section-by-section checklist.
2. Features pages: do buyers find the job they came for?
Visitors who open a features page have usually decided the product might fit. Now they're checking whether it does the one or two jobs they care about. Most features pages answer with a long list of equal-looking blocks, and buyers skim it.
Main signal: which feature blocks get reached and clicked, whether tabs and accordions hide the useful parts, and whether anyone clicks through to pricing or signup afterwards. Nielsen Norman Group's eyetracking research describes how people scan: in the F-shaped pattern they read across the first lines, then less and less, mostly down the left side, so headings do most of the work. In the 2018 scrolling study, people spent about 57% of their page-viewing time above the fold, 74% in the first two screenfuls, and 81% in the first three (NN/g, F-Shaped Pattern of Reading; NN/g, Scrolling and Attention). The feature that wins most deals shouldn't be ninth on the list. The features page heatmap guide lists the patterns and where to put the next step.
3. Pricing: do visitors pick a plan and continue?
The pricing page is where interest turns into a choice. Visitors compare plan columns, open FAQs and look for billing terms. A heatmap shows which columns get attention, which rows and tooltips they click, and whether they reach the button or leave from a FAQ or a menu link.
Main signal: clicks on a plan button compared with clicks on comparison rows, FAQ items and ways to leave, plus how far people scroll on a long pricing page. Lots of clicks on the cheapest plan and few trials started often means the next page, not the pricing page, is the problem. The pricing page heatmap guide covers the reading, and SaaS pricing page best practices has the design checklist.
4. Signup or demo request: do they finish?
This is the last step, and it's easy to blame the form when the earlier pages sent the wrong people, or to ignore the form when the map on pricing looked fine. Read the signup page or demo form on its own, split by device, and pair the heatmap with form events so you can see starts versus completions.
Main signal: dead or rage clicks on fields, social or single-sign-on buttons, and legal or plan-term links that pull people out of the form. On a phone, check whether the main button sits below the average fold after the fields. The signup page heatmap guide covers trial forms. If the next step is a booked call rather than a self-serve trial, see demo request pages and form abandonment analysis.
Mobile and desktop are different sites
On most SaaS sites, the same template behaves differently on each device. The menu becomes a hamburger, plan tables stack, feature grids turn into a long column, and forms get much taller. Read every step on both devices before you decide where the biggest loss is. A step that looks healthy on desktop can be the worst step on mobile, and if mobile brings most of your traffic, that's the one to fix. If your mobile numbers trail desktop across the board, start with why mobile conversion rates are low.
How much traffic you need
Clarity notes there's no minimum traffic needed to generate a heatmap (Microsoft Clarity, Heatmaps overview). That's true of drawing the map, not of reading it. A map from a few dozen visits mostly shows what those few people did.
A few hundred page views per device for each page type is a sensible minimum. Pricing and signup pages often get less traffic than the homepage, so you may need a longer window for those steps. Group pages that share a template to get there faster, and watch a few session recordings to confirm what the map suggests. For a first look at a new page that has no traffic yet, our free page leak scan predicts where attention lands. It's a prediction, not your visitors' behavior, but it shows where to look first.
Common misreads on SaaS heatmaps
- Reading the homepage first because it has the most traffic. High traffic is not the same as a high loss. Start with the step that loses the most people on the way to a trial or a demo.
- Treating a hot button as a win. A pricing or signup button can take lots of clicks and still lose people on the next page. Follow the click into that step.
- Mixing all traffic together. Customers visiting billing, people heading to Login, and prospects comparing plans will smear the map. Segment when one group is large.
- Ignoring tabs, accordions and plan toggles. Monthly versus annual, or a closed FAQ, changes what the screenshot shows. Clarity notes that a page impression might not show the element a user clicked (Microsoft Clarity, Click maps). Write down which state you're looking at.
- Using a scroll event as a substitute for a scroll map. GA4's enhanced measurement scroll event fires once, the first time a visitor reaches 90% of the page (Google Analytics, Enhanced measurement events). It does not tell you where people stopped before that. Use the scroll map for the drop-off, and the event only as a rough "reached the bottom" count.
Turn one pattern into one change
Pick the single pattern that affects the most visitors at the step that loses the most people, and write it down as a hypothesis with a number you can re-check. For example (illustrative): "On mobile, the share of pricing visitors who start a signup is much lower than on desktop, and the main button sits below the plan comparison, past the average fold. Move a signup button above the comparison, and compare signup starts per pricing view over two equal weeks."
Our CRO hypothesis template gives you a format for writing these down. If your site doesn't send enough traffic for a proper A/B test, CRO without A/B testing shows how to measure a before-and-after honestly. If you'd rather not run that re-measurement by hand, every Cortality plan re-measures each fix you ship; compare the plans.
SaaS heatmap checklist (copy this)
- Funnel written down: homepage or landing → features → pricing → signup or demo
- The step with the biggest drop chosen first
- Pages that share a template grouped; the busiest page of each type also read alone
- Desktop and mobile read separately
- Large traffic sources (ads, email, docs) read on their own
- A few hundred page views per device for each page type
- Click and scroll maps read together for the chosen step
- Tabs, plan toggles and other page states noted in the screenshot
- Signup or demo completion tracked as an event, not only as a button click
- One change shipped, re-measured over the same window length
Where Cortality fits
Most of this comes down to one question: what do visitors actually see, skip and click at each step of your site, and where do they stop? Cortality measures how real visitors use every part of your pages, including the menu, the feature blocks, the plan buttons and the signup form, on each device. You get a ranked list of fixes, each with the evidence and the exact change to make, and after you ship a fix Cortality re-measures it and tells you whether it worked. It works alongside Google Analytics and Microsoft Clarity rather than replacing them. See how it works or what a finding looks like. For software teams, see Cortality for SaaS.
For a quick first look, our free page leak scan takes about a minute and needs no install. It's a prediction from our attention model, not data from your real visitors, so use it to decide where to look first.
Plans are $99, $249 or $499 a month (Starter, Growth and Scale). Start your free week, and you see your first report before you pay. You save a card at signup, and nothing is charged until 3 days after your first report. Cancel before then and you pay nothing, and any charge can be refunded within 14 days. How the free week works.
Questions
What is a SaaS heatmap?
A picture of where visitors click or tap, how far they scroll and, in some tools, where they spend time on a software company's site, added up across many visits. It's most useful read by page type (homepage, features, pricing, signup or demo request), because each step has a different job and a different thing to look for.
Which page of my SaaS site should I read first?
The step that loses the most visitors. Use your analytics to see what share of people move from the homepage to features or pricing, and from pricing to signup or a demo request, then read the heatmap for the step with the biggest drop. That's usually more useful than starting with the homepage because it gets the most traffic.
Do I need a separate heatmap for every features or pricing page?
No. Pages that share a template can be grouped so you can judge the layout once. Read your busiest features page, and your main pricing page, on their own to judge the content. If you have a separate page per feature, group them for the template and open the one your ads or sales team send people to.
How much traffic does a SaaS heatmap need?
A few hundred page views per device for each page type you read is a sensible minimum. Tools like Microsoft Clarity will draw a map from any amount of traffic, but a map from a few dozen visits mostly shows those few visitors. Group pages that share a template, and back up what you see with a few session recordings.