Homepage Heatmap: What Visitors Click, Skip and Scroll Past
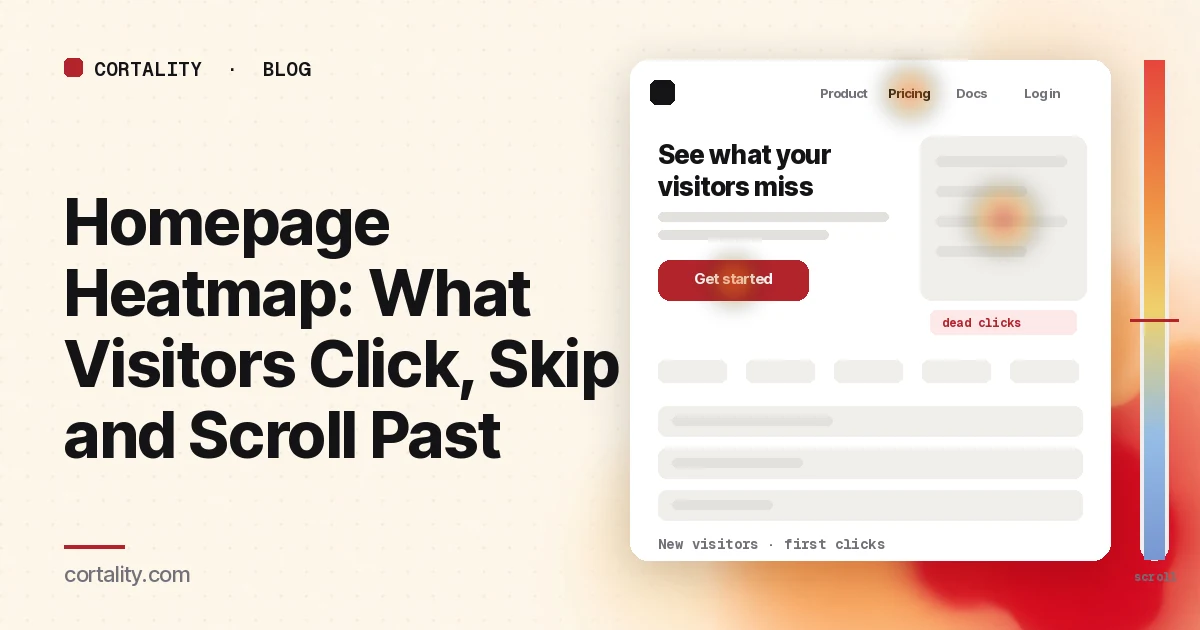
Your homepage gets more traffic than any other page, and your analytics shows a bounce rate and a few exit paths. It doesn't show what people did while they were there. A homepage heatmap does: whether new visitors clicked your main button or went straight to the menu, which sections they scrolled past without stopping, and what they tapped expecting something to happen.
This guide is about reading that data. If you want a list of what a good homepage includes, start with our SaaS homepage best practices or, for stores, our Shopify homepage design checks. If you're new to heatmaps in general, how to read a website heatmap covers the basics first.
Set it up so the map means something
A heatmap averages many visits into one picture. The homepage gets the most mixed traffic on your site, so how you filter it matters more here than anywhere else.
- Separate new visitors from returning ones. Customers use the homepage as a shortcut to log in, open docs or find support. First-time visitors are deciding whether you're worth their time. Mixed together, the "Log in" link can look like your most important element. Read new visitors on their own first.
- Split by device. On a phone, the navigation usually collapses into a menu icon, the hero stacks, and sections that sit side by side on desktop become a long column. The maps won't look alike. Our guide to mobile vs desktop heatmaps explains why.
- Split by where visitors came from. Someone who searched your brand name is looking for a specific page. Someone from a paid ad or a social post is meeting you for the first time. If you pay to send traffic to the homepage, read that segment on its own.
- Use a long enough, fixed window. Aim for a few hundred page views per device, and keep the window the same length when you compare before and after a change. Leave out days with a launch, a press mention or an email blast unless that's what you're studying.
- Know the page's states. Homepages often have a rotating hero, a cookie banner, an announcement bar or a popup. Clarity's click maps rank elements across all page views and note that the screenshot might not show the element a user clicked (Microsoft Clarity, Click maps). Write down which state you're looking at before you trust where the heat sits.
Read the first-click map before the all-clicks map
The all-clicks map tells you what's popular. On a homepage, the first click tells you more: where visitors went once they'd seen the top of the page. Microsoft Clarity, for example, offers first-click and last-click maps alongside all clicks, rage clicks and dead clicks, and ranks elements by their share of clicks, including clicks on things that aren't links (Microsoft Clarity, Click maps).
Take the first-click ranking for new visitors and sort the top ten elements into four groups:
- Your main action (the hero button, a signup or "shop now" link)
- Navigation (menu items, the logo, the menu icon on mobile)
- Content links (a product tile, a case study, the blog)
- Things that aren't links (images, headings, icons, a stat, a logo strip)
Then look for these patterns.
Navigation beats the main button
If "Pricing", "How it works" or "Features" gets more first clicks than your hero button from new visitors, they want something the top of the page didn't give them. That isn't automatically bad: a visitor who opens pricing is still moving forward. What to check:
- Which menu item wins. Heavy first clicks on "Pricing" usually mean visitors want to know the cost before they invest more time. Clicks on "How it works" or "Product" mean the headline didn't explain what you do. Heavy clicks on "About" can mean the same thing, or that visitors want to know who is behind the site before they go further; an about page heatmap shows what they look for once they get there. Our navigation heatmap guide covers how to read menu clicks in detail.
- Whether the clicks spread out. One or two strong menu items is a clear signal. Clicks spread across six or seven items, with no clear winner, usually means visitors are hunting.
- The logo. Clicks on the logo while already on the homepage are often visitors who expected it to do something else, or who are lost. A small share is normal. A large share from new visitors is worth a few session recordings.
The hero gets clicks, but not on the button
Dead clicks on a hero image, a product screenshot or a headline mean visitors expected something there. Clarity marks clicks that produce no response as dead clicks. Common causes on homepages:
- A product screenshot that looks like a demo. People tap it expecting a video or a closer look. Either make it open a larger view, or make it clearly an image.
- A banner or slide with a message but no link. If a rotating hero promotes an offer and the slide isn't clickable, every tap on it is lost.
- Underlined or colored text that isn't a link. Change the styling or make it a link.
Rage clicks on the button itself
Rage clicks are fast repeated clicks in one small area. On a homepage button they usually point to something slow or broken: a button that waits on a script, a signup modal that takes seconds to open, or a link that loads a blank page on some browsers. Test the button on a real phone with a slow connection before changing the design. Our guide to rage clicks and dead clicks covers the differences.
Then read the scroll map
The scroll map tells you what share of visitors reached each section. Clarity's scroll map shows the percentage of visitors at each point and the average fold, which is roughly where the first screen ends for your visitors on that device (Microsoft Clarity, Scroll maps).
Expect a steep drop. In Nielsen Norman Group's eyetracking research, people spent about 57% of their page-viewing time above the fold and about 74% in the first two screenfuls; the rest was spread thinly further down (Nielsen Norman Group, Scrolling and Attention). A homepage where most people leave after two or three screens is normal. What matters is what sits in those screens, and whether the drop happens in the wrong place.
Write down where the parts that matter sit, then read the percentage at each:
- The second button (the one you repeat after the hero, if you have one)
- Proof (customer logos, a testimonial, a number)
- The "how it works" or product section
- Pricing teaser or plan summary
- The final call to action before the footer
Then look for these shapes:
- A sharp drop right after a full-width section. A big image, a video block or a band of whitespace can look like the end of the page. NN/g calls this a false floor and recommends visual cues that more content follows. If the drop happens right below such a section, and proof or your second button sits below it, move them up or break the section.
- Most visitors never reach your proof. If logos or testimonials sit at screen four and only a small share gets there, they aren't helping the visitors who needed reassurance at screen one. Put a short proof line next to the hero button. Our guide to trust signals before the first button covers what to use.
- A long, steady fade on mobile. On a phone the same content can be three times as many screens. Our mobile homepage length test shows how to measure that and what to cut.
Reaching a section isn't the same as reading it. Our scroll map guide covers how to tell a natural exit from a false bottom.
Common mistakes reading homepage heatmaps
- Reading all traffic as one group. Customers looking for the login link drown out new visitors deciding whether to sign up.
- Treating menu clicks as failure. The homepage is a routing page. The question is whether new visitors find a clear next step, not whether every click lands on the hero button.
- Ignoring the rotating hero. If the hero has three slides, the screenshot shows one. Heat on that area belongs to whichever slide each visitor saw.
- Judging the bottom of the page by its colors. Cold color at the bottom of a long homepage is expected. Judge each section by the share of visitors who reached it and whether it needed to be seen.
- Stopping at the click. A healthy click share on your hero button doesn't mean people sign up or buy. Follow them to the next page before you call the homepage fixed.
Turn one pattern into one change
Pick the single pattern that affects the most new visitors near the top of the page, and write it down as a hypothesis with a number you can re-check. For example (illustrative): "On mobile, new visitors make 3 times as many first taps on the menu icon as on the hero button, and 'How it works' is the top menu item. Rewrite the headline to say what the product does in one line, add a 'See how it works' link under the button, and compare hero button first-click share over two equal weeks."
Our CRO hypothesis template gives you a format for writing these down. If your homepage doesn't get enough traffic for a proper A/B test, CRO without A/B testing shows how to measure a before-and-after honestly.
Homepage heatmap checklist (copy this)
- New and returning visitors read separately
- Desktop and mobile read separately
- Paid and social traffic that lands on the homepage read as its own segment
- A few hundred page views per device in the window, with no launch or blast inside it
- Rotating hero, banner and popup states noted before reading heat
- First-click ranking sorted into main action, navigation, content links and non-links
- Top menu item for new visitors noted, and what it says about the hero
- Logo clicks from new visitors checked
- Dead clicks on hero images, screenshots and banners listed
- Rage clicks on the main button tested on a real phone
- Scroll share recorded for the second button, proof, product section, pricing teaser and final call to action
- False floors checked below full-width sections
- One change shipped, re-measured over the same window length
Where Cortality fits
Most of this comes down to one question: what do visitors actually see, skip and click on your homepage, and where do they stop? Cortality measures how real visitors use every part of your page, including the navigation, the hero and each section below it, on each device. You get a ranked list of fixes, each with the evidence and the exact change to make, and after you ship a fix Cortality re-measures it and tells you whether it worked. It works alongside Google Analytics and Microsoft Clarity rather than replacing them. For how it compares with GA4, Clarity, Hotjar and other tools marketers use, see our roundup of UX analytics tools for marketers. See how it works or what a finding looks like. For the rest of the path from homepage to signup, see Cortality for SaaS teams.
For a quick first look, our free page leak scan takes about a minute and needs no install. It's a prediction from our attention model, not data from your real visitors, so use it to decide where to look first.
Plans are $99, $249 or $499 a month (Starter, Growth and Scale). Start your free week, and you see your first report before you pay. You save a card at signup, and nothing is charged until 3 days after your first report. Cancel before then and you pay nothing, and any charge can be refunded within 14 days. How the free week works.
Questions
What does a homepage heatmap show?
Where visitors click and tap on your homepage, how far down they scroll, and, in tools with attention maps, where they spend time. Read together, they show whether people take your main action, which menu items they use instead, and which sections most visitors never reach.
Is it bad if most homepage clicks go to the navigation?
Not by itself. A homepage is a routing page, and many visitors arrive knowing where they want to go. It becomes a problem when new visitors from ads or search skip your main button and spread their clicks across many menu items, which usually means the top of the page didn't tell them what to do next.
Should I read new and returning visitors separately?
Yes. Returning visitors and customers often use the homepage as a shortcut to log in, open the blog or reach support. Mixed with first-time visitors, their clicks can make the hero button look ignored when new visitors are actually using it.
How much traffic do I need before reading a homepage heatmap?
Enough that each device has a few hundred page views in the date range you're reading. Most sites reach that on the homepage first, which is one reason it's a good place to start reading heatmaps.