Ongoing website autopsies
See why visitors don’t buy. Then fix it.
One tag measures how real visitors use every part of your page. You get the fixes in order, and we re-measure to prove each one worked. Ranked fixes, and proof each one worked.
- Free page scan: a prediction of where visitors look
- About a minute
- No install needed

Illustration shown with mockup data on a sample page.
What you get
Not a heatmap. A fix, with the number behind it.
Heatmaps and session recordings show you color and video to interpret. Cortality measures how real visitors use every element of your landing page, ranks the fixes, and re-measures each one. Keep using Google Analytics or Microsoft Clarity alongside it.
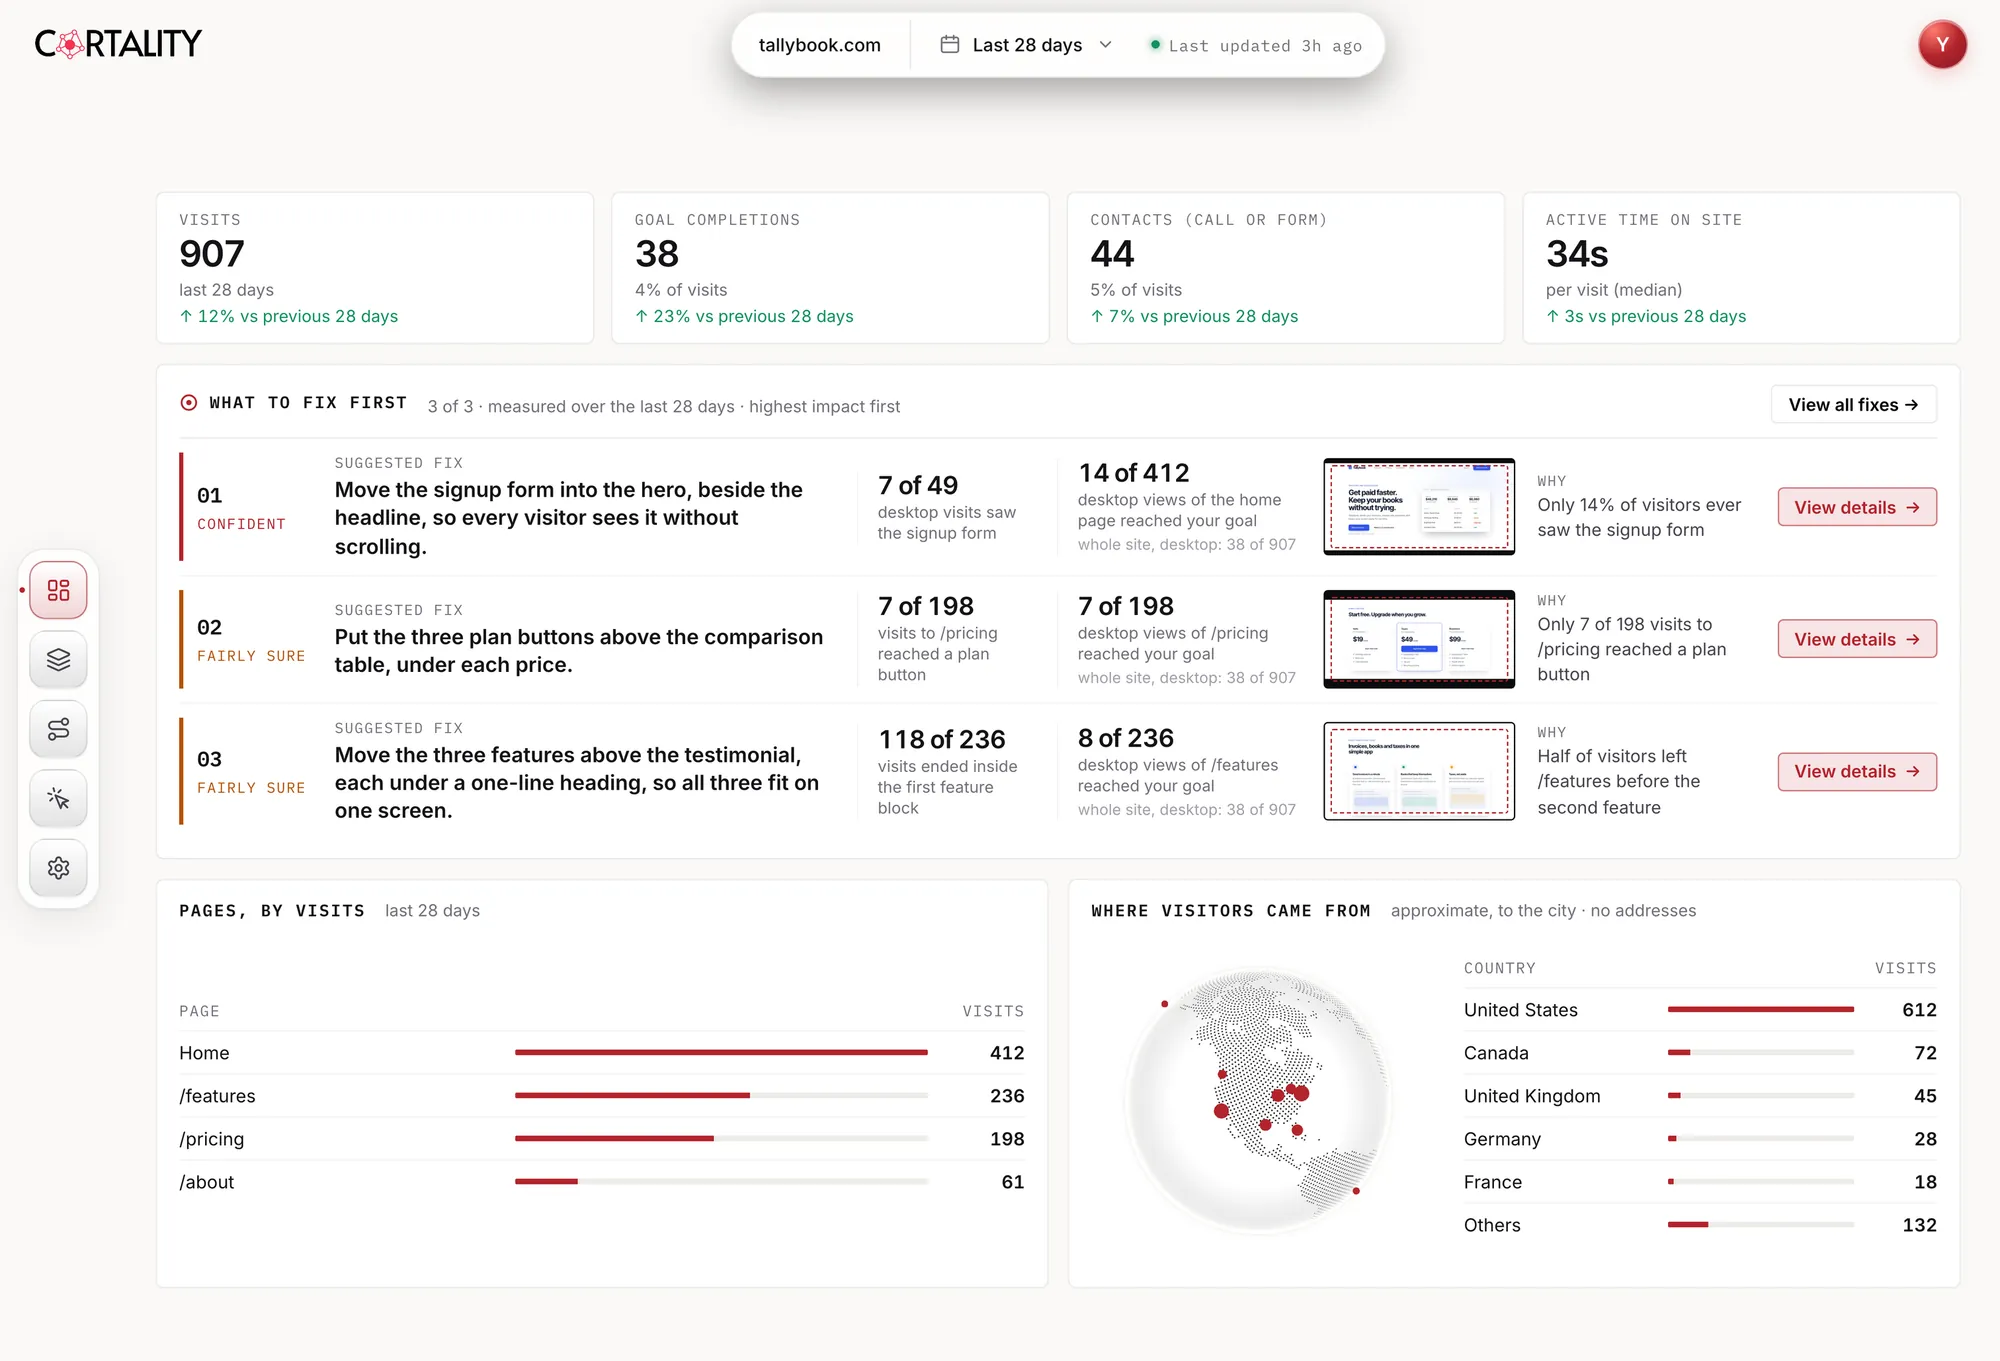
Every finding is four lines: what we measured, why it costs you, the exact change, and the re-measure that proves it. Here is one from a real client report.
Measured, not promised
What happens after the first fix ships.
Measured on live client traffic
The share of visitors reaching a client’s signup form more than doubled within one week of our recommended fix going live. Same instrumentation, before and after. One client’s measured result; results vary.
The report itself was insane. We could not believe how much you were able to pull from our own traffic.
StackingCashCortality shows us exactly what moves conversions. It has become a core part of how we make every change.
Sarsona CapitalHow it works
Three steps. Almost no work on your side.
Paste one tag
You or your developer add one line to your site. The setup screen confirms it’s working.
About 5 minutesWe measure real visitors
Every scroll, click and pause, on every part of the page. No cookies, and form values never leave the browser.
First week, freeGet your Fix List
Your biggest leaks, in order, each with the evidence and the exact change. Ship one and we re-measure it.
Every week or monthPricing
See your first report before you pay.
We measure your site free for a week and send your first report. Your first charge comes 3 days later, so you can cancel before then and pay nothing.
Starter
One page. Small and lead-gen sites.
Growth
Three pages. Stores and SaaS.
Scale
Five pages. Teams and high traffic.
Won’t slow your site
One async tag that loads in the background. If anything goes wrong inside it, it shuts itself off. Install docs
Private by design
No cookies, no names, no camera. Form values are masked on the visitor’s device before anything is sent. Trust Center
Works with what you have
Keep Google Analytics and Microsoft Clarity. They show what happened; we show which part of the page caused it. The difference
Free first week
Find out what your page is losing.
Create an account, add your site and paste one tag. Your first week is free, and you pay only after your first report.
About 5 minutes to set up. We save your card, and nothing is charged until 3 days after your first report.
Already have an account? Log in
Running many sites? Partner options · Not ready to install? Scan your page free