About Page Heatmap: What Visitors Check Before They Trust You
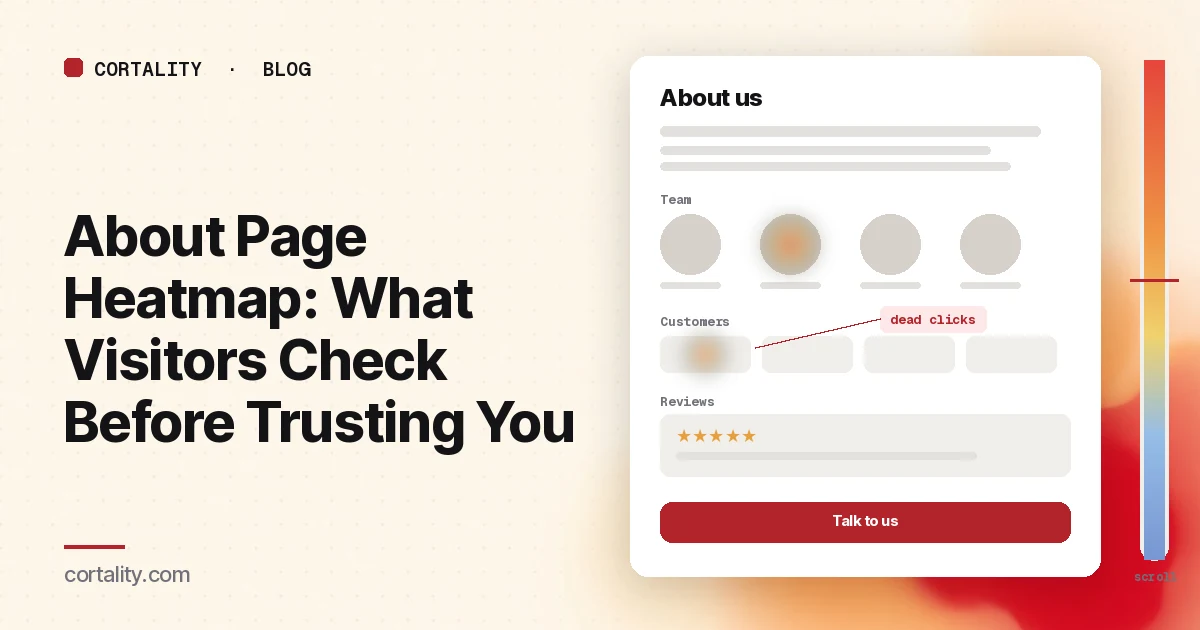
Most teams write their about page once, at launch, and never look at it again. It feels like a page for job seekers and journalists. But a lot of the people who open it are buyers in the middle of a decision. They've seen your homepage or pricing, and before they enter a card, book a call or share an email, they want to know who is behind the site.
An about page heatmap shows what those visitors actually check. Do they read the summary of what you do, or skip it? Do they click the team photos? Do they look for reviews, customer logos or a way to talk to someone? And where do they go next: on to pricing or contact, or back to search to look you up somewhere else?
This guide covers what visitors look for on an about page, how to set up the map so it means something, how to read the clicks and the scroll, the mistakes that send teams after the wrong fix, and how to turn one pattern into a change you can measure. If you're new to the maps themselves, how to read a website heatmap covers the basics first.
What visitors look for on an about page
Nielsen Norman Group has studied about pages for more than a decade. For its most recent report it ran three rounds of research, observed over 70 users, tested 100 websites and reviewed 65 more, and published 85 guidelines (NN/g, "About Us" Information on Websites). The findings that matter most when you read a heatmap:
- People want to know what you do. NN/g saw journalists, investors and general users unable to work out what some organizations did, and recommends a clear phrase or a short paragraph that says it.
- Users are skeptical. Participants in the most recent round were more skeptical than in earlier studies. Companies that stood out used storytelling, realistic photography, unbiased reviews, and more than one way to reach a real person.
- Reviews carry a lot of weight. In NN/g's 20 most recent sessions, participants used the word "reviews" more than 40 times, and many compared a company's own claims with third-party review sites.
- Structure helps. NN/g suggests four levels of detail: a tagline on the homepage, a one-to-two paragraph summary at the top of the about page, deeper pages (or sections) for things like team, history and careers, and about links in the footer. Users relied heavily on the footer as a fallback when they couldn't find something in the main navigation.
- Most of this research happens on desktop. The majority of users in that study said they usually learn about companies on desktop rather than on mobile.
The same research lists what hurt satisfaction with about content: hard-to-find critical information such as what the company does and whom to contact, content that lacked substance, stock photography, walls of text, cluttered layouts, aggressive sales tactics, and layouts that weren't mobile friendly. Most of those show up on a heatmap.
What an about page heatmap shows
A heatmap adds up behavior from many visits onto one screenshot of the page. Microsoft Clarity, a free analytics product from Microsoft, offers click maps, scroll maps, area maps, attention maps and conversion maps, and states that there's no minimum traffic needed to generate a heatmap (Microsoft Clarity, Heatmaps overview). On an about page, three of them are most useful:
- Click maps show where people click on a desktop and tap on a phone or tablet, including on things that aren't links. Clarity ranks clicked elements by number of clicks and can switch to dead clicks, rage clicks, error clicks, first clicks and last clicks (Microsoft Clarity, Click maps).
- Scroll maps show the share of visitors who reached each 5% of the page, the drop-off at each point, and the average fold (Microsoft Clarity, Scroll maps).
- Attention maps show how long visitors spend on each part of the page. About pages are text-heavy, so this is the map that tells you whether the story, the mission statement or the team section actually gets read.
Conversion maps are only available on projects where Clarity detects purchase events (Microsoft Clarity, Conversion maps), so for most about pages you'll judge outcomes with your own events instead.
A heatmap shows what happened on the about page. It doesn't show whether the visitor went on to buy, or whether they searched for reviews of your company in another tab. Pair the map with your analytics and a few session recordings.
Set it up so the map means something
- Decide what the page is for. An about page that feeds buyers toward pricing or a demo is read differently from one written mainly for recruiting or press. Write down the one or two next steps you want: pricing, contact, signup, careers. You'll judge the click map against them.
- Read the main about page on its own. If you have subpages such as team, careers or press, read them separately. Group them only when they share a template and you're judging the layout.
- Split by device, but expect desktop to lead. NN/g's participants mostly researched companies on desktop, so your desktop map may have more data. Still read mobile on its own: team grids, timelines and logo walls stack into very long columns on a phone. Mobile vs desktop heatmaps explains why the maps differ.
- Split by where visitors came from. People who reach the about page from your pricing page are often close to buying. People who arrive from a press mention or a job board want something else. If one source is large, read it separately.
- Track the next steps as events. Count how many about page sessions go on to pricing, contact, signup or a lead form. Google Analytics 4 recommends a generate_lead event for form submissions, newsletter sign-ups and demo requests (Google Analytics, Recommended events reference). Enhanced measurement can also send an outbound click event each time someone follows a link to another domain, which is how you'll see clicks to LinkedIn or review sites (Google Analytics, Enhanced measurement events).
- Use a long, fixed window. About pages are often quiet. Aim for a few hundred views per device, and keep the window the same length when you compare before and after a change. Heatmaps on a low-traffic website covers what you can still read on a quiet page. If you're rewriting the page and have no data on the new version yet, our free page leak scan predicts where attention will land. It's a prediction, not your visitors' behavior, but it shows where to look first.
Read the click map as a ranked list
Sort the top clicked elements in Clarity's ranking into five groups:
- Who: team photos, founder names, LinkedIn icons, "meet the team" links
- Proof: customer logos, review widgets, ratings, press logos, case-study links
- Story: the summary, timeline, mission or values sections, videos
- Next steps: pricing, contact, signup, demo, careers
- Ways out: the menu, the logo, footer links, outbound links to social or review sites
Then ask what each group is telling you.
Dead clicks on team photos and customer logos are requests for more. Visitors who click a founder's photo want a name, a role or a profile. Visitors who click a customer logo want to know what you did for that customer. Switch Clarity to dead clicks: if those elements light up, link them to something useful, such as a short bio, a LinkedIn profile or a case study. If you can't, make them look clearly decorative so people stop trying.
Heavy clicks on outbound links to review sites or LinkedIn are not a failure. They match what NN/g saw: skeptical users check what others say. It's better that they check from your page than that they leave for a search engine. Make sure those profiles are up to date, and consider showing honest reviews on the page so people don't have to leave to find them.
Few clicks on next steps means the page is a dead end. If almost nobody goes from the about page to pricing, contact or signup, check whether there's a clear link to any of them. Many about pages end with a mission statement and a footer. A short closing line that points to the next step, and a visible contact link, give people somewhere to go. NN/g's contact guidelines also recommend that contact details on an about page supplement, not replace, a main contact link in the header and footer (NN/g, 'Contact Us' Page Guidelines). Our contact page heatmap guide covers the page they land on next.
Clicks on the summary or tagline text usually mean nothing on their own. If attention there is low and the page has a long story above it, though, people may not be finding the one paragraph that says what you do. Move it to the top.
First clicks on the menu can mean visitors expected something else, such as pricing or contact, and are leaving to find it. Check where those clicks go.
Then read the scroll map
About pages tend to be long: a hero, a story, a timeline, a values section, a team grid, a logo wall, a careers block. Most visitors won't see all of it. Nielsen Norman Group's 2018 eyetracking study found people spent about 57% of their page-viewing time above the fold, 74% in the first two screenfuls and 81% in the first three (NN/g, Scrolling and Attention).
Check three things:
- What sits above the average fold. If the first screen is a large stock photo and a slogan, the visitors who never scroll learn nothing about what you do. NN/g lists stock photography and content that lacks substance among the factors that hurt satisfaction. Put the one-paragraph summary and a real photo there.
- Where the steep drop happens. If most visitors leave before the team or the reviews, and those are what build trust, move them up. A timeline of founding dates rarely needs to sit above them.
- Whether anyone reaches the closing call to action. If the only link to pricing or contact sits at the very bottom and the scroll map shows few visitors get there, add one higher up.
The scroll map also checks your analytics. GA4's enhanced measurement fires its scroll event only the first time a visitor reaches 90% of the page (Google Analytics, Enhanced measurement events), which won't tell you whether people saw a team section at 50%.
Common mistakes reading about page heatmaps
- Assuming nobody reads it. Low traffic is not low value. The few people who open your about page are often the most serious ones. Check what share of about page sessions go on to pricing or contact, and compare it with the site average.
- Reading the story by the clicks. Text doesn't get clicked. Use the attention map and the scroll map for the story sections, and the click map for links, photos and logos.
- Treating outbound clicks to reviews as leaks. Visitors will check reviews anyway. If they leave from your page, make sure what they find there is current, and give them a clear way back to the next step.
- Mixing desktop and mobile. A team grid of twelve photos is one screen on desktop and several screens on a phone. Read them separately.
- Fixing the about page when the homepage is the problem. If visitors open the about page only because the homepage didn't say what you do, the better fix may be a clearer homepage tagline, the first of NN/g's four levels. The homepage heatmap guide shows how to check, and trust signals before your first CTA covers which proof belongs higher up the funnel.
Turn one pattern into one change
Pick the single pattern that affects the most about page visitors and write it down as a hypothesis with a number you can re-check. For example (illustrative): "On desktop, dead clicks cluster on customer logos, the scroll map shows most visitors leave before the reviews block, and few about page sessions reach pricing. Link each logo to a short case study, move the reviews above the timeline, and compare the share of about page sessions that reach pricing or contact over two equal weeks."
Our CRO hypothesis template gives you a format for writing these down. If the page doesn't get enough traffic for an A/B test, CRO without A/B testing shows how to compare a before-and-after honestly. If you'd rather not run that re-measurement by hand, every Cortality plan re-measures each fix you ship; compare the plans.
About page heatmap checklist (copy this)
- One or two next steps written down (pricing, contact, signup, careers)
- Main about page read on its own, subpages separately
- Desktop and mobile read separately
- Large traffic sources (pricing page, press, job boards) read on their own
- A few hundred about page views per device in a fixed window
- Click ranking sorted: who, proof, story, next steps, ways out
- Dead clicks checked on team photos, customer logos and press logos
- Attention and scroll maps checked: summary of what you do above the average fold
- A link to pricing or contact visible before the steepest scroll drop
- Next-step and outbound clicks arriving as events
- One change shipped, re-measured over the same window length
Where Cortality fits
Most of this comes down to one question: what do visitors actually see, skip and click on your about page, and do they go on to the next step? Cortality measures how real visitors use every part of your page, including the summary, the team section, the reviews and the links to pricing and contact, on each device. You get a ranked list of fixes, each with the evidence and the exact change to make, and after you ship a fix Cortality re-measures it and tells you whether it worked. It works alongside Google Analytics and Microsoft Clarity rather than replacing them. See how it works or what a finding looks like. For software companies, see Cortality for SaaS.
For a quick first look, our free page leak scan takes about a minute and needs no install. It's a prediction from our attention model, not data from your real visitors, so use it to decide where to look first.
Plans are $99, $249 or $499 a month (Starter, Growth and Scale). Start your free week, and you see your first report before you pay. You save a card at signup, and nothing is charged until 3 days after your first report. Cancel before then and you pay nothing, and any charge can be refunded within 14 days. How the free week works.
Questions
What does an about page heatmap show?
Where visitors click or tap on your about page, how far they scroll, and which elements they click that don't respond. It shows whether people read the company summary, look at the team, check reviews or customer logos, and whether they go on to contact you, see pricing or leave.
Does the about page matter for conversions?
For many sites, yes. People who open an about page are often checking whether a company is real and trustworthy before they buy, book a demo or share their email. Nielsen Norman Group's research found users compare what a company says about itself with third-party reviews before they decide. If the about page doesn't answer their questions, they look elsewhere.
Why do visitors click team photos or customer logos?
Usually because they want more: a name, a role, a LinkedIn profile, or the story behind a customer logo. If those elements aren't links, the click map shows dead clicks on them. Either link them to something useful, such as a short bio or a case study, or make them look clearly decorative.
How much traffic does an about page heatmap need?
A few hundred about page views per device in the window you're reading is a sensible minimum. Microsoft Clarity will draw a heatmap from any amount of traffic, but a map from a few dozen visits mostly shows those few people. About pages are often quiet, so a longer window and a few session recordings help.