Contact Page Heatmap: What Visitors Look For Before They Reach Out
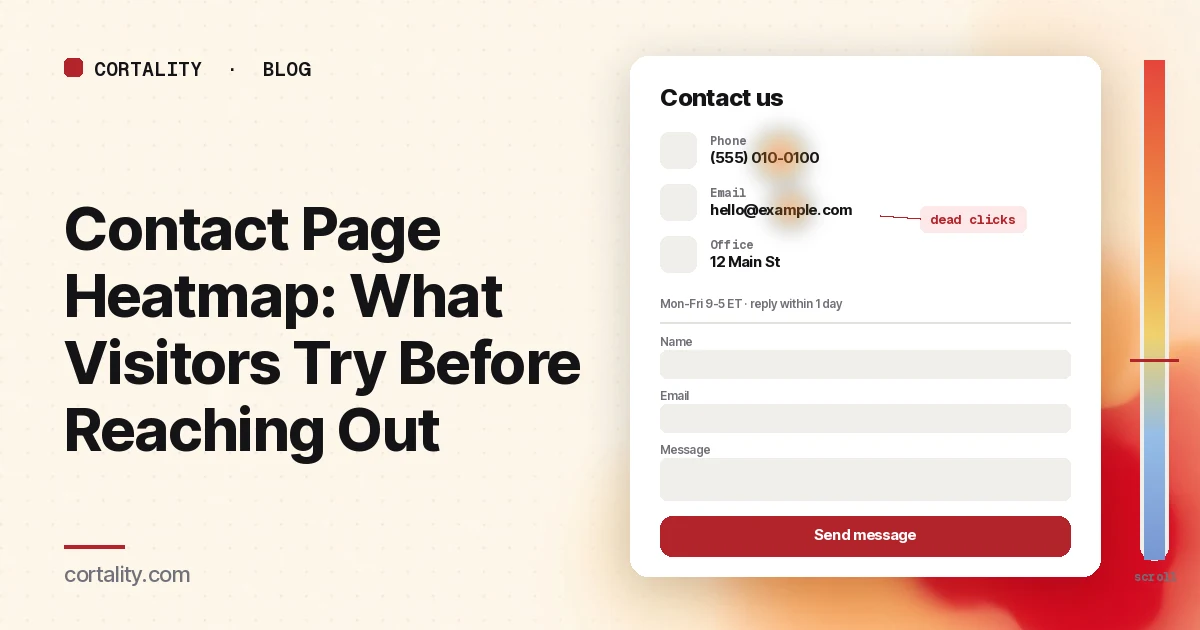
The contact page is where a visitor stops reading about you and tries to talk to you. Some of them are ready to buy and want a quote. Some have a question your site didn't answer. Some are partners, press or job seekers. What they have in common is that they've already decided to reach out, so every one you lose here is a lead or a customer you nearly had.
That makes the contact page one of the most useful pages to put a heatmap on, and one of the most overlooked. It's short, it rarely gets redesigned, and teams assume it works because it gets a few form submissions a week. A contact page heatmap shows what the rest of the visitors tried to do: which way they wanted to reach you, what they clicked that didn't respond, and whether they ever got to the form.
This guide covers how to set the map up, how to read the clicks and the scroll, the mistakes that send teams after the wrong fix, and how to turn what you see into one change you can measure. If you're new to heatmaps, how to read a website heatmap covers the basics first.
What visitors expect from a contact page
Before you read the map, it helps to know what people come looking for. Nielsen Norman Group ran a qualitative usability study with 20 business professionals on 40 corporate websites and published 12 guidelines for contact pages from it (NN/g, 'Contact Us' Page Guidelines). A few of their findings matter most when you read a heatmap:
- People expect a phone number and an email address, not just a form or a street address. The majority of users in that study said they preferred talking to a real person on the phone to get questions answered.
- A form should add to direct contact, not replace it. Users saw forms as a barrier, worried their email would be used for marketing, and felt they were handing control of the conversation to the company.
- If there is a form, keep it short. NN/g recommends three to five fields, asking only for what you need to reply.
- Tell people when you'll answer. NN/g reports that most users expect a reply to an email or form within 24 hours, and recommends stating hours, time zones and response times for each channel.
- People look for the contact link in the top right corner of the page or in the footer. Sites that hide it come across as evasive.
Keep that list next to you. A heatmap tells you what visitors did. These findings help you guess why.
What a contact page heatmap shows
A heatmap adds up behavior from many visits onto one screenshot of the page. Microsoft Clarity, a free analytics product from Microsoft, offers click maps, scroll maps, area maps, attention maps and conversion maps, and states there's no minimum traffic needed to generate one (Microsoft Clarity, Heatmaps overview). On a contact page, two of them do most of the work:
- Click maps show where people click on a desktop and tap on a phone or tablet, including on things that aren't links. Clarity ranks clicked elements by number of clicks, and can switch the view to dead clicks (a click with no response), rage clicks (fast repeated clicks in one small area), error clicks, first clicks and last clicks (Microsoft Clarity, Click maps).
- Scroll maps show what share of visitors reached each 5% of the page, the drop-off at each point, and the average fold: how much of the page people see before they start scrolling (Microsoft Clarity, Scroll maps).
Attention maps can help if your contact page carries a lot of text, such as office details for many locations. Conversion maps are only available on projects where Clarity detects purchase events (Microsoft Clarity, Conversion maps), so on most contact pages you'll use your own lead events instead.
What a heatmap can't show is whether a phone call happened, whether an email was sent from someone's mail app, or whether a submitted form turned into a sale. Pair it with events in your analytics and, where you can, with call or inbox counts.
Set it up so the map means something
- Read the contact page on its own. Don't group it with your demo request or quote page, even if they share a form component. Someone on a contact page might be a customer with a support question. Someone on a demo page is usually a buyer. If you have both, read each separately, and see our guide to the demo request page for that one.
- Split by device. On a phone, the contact options often stack into one column, a map embed can fill the first screen, and the form can end up far below the fold. A tap on a phone number does something very different from a click on a desktop. Read desktop and mobile separately; mobile vs desktop heatmaps explains why the maps differ.
- Split by where visitors came from. People who arrive from the footer of a support article behave differently from people who click "Contact sales" in your header. If one source sends most of your contact traffic, read it on its own.
- Track the outcomes as events. Google Analytics 4 recommends a generate_lead event for initial lead acquisition such as form submissions, newsletter sign-ups or demo requests (Google Analytics, Recommended events reference). Enhanced measurement can also send form_start the first time someone interacts with a form in a session and form_submit when they submit it, so you can compare starts with submits (Google Analytics, Enhanced measurement events). Add click events for tap-to-call and mailto links, because GA4 won't count those as leads on its own.
- Use a fixed, long enough window. Aim for a few hundred contact page views per device, and keep the window the same length when you compare before and after a change. If the page is quiet, heatmaps on a low-traffic website covers what you can still learn. If you're about to launch a new contact page and have no traffic on it yet, our free page leak scan predicts where attention will land. It's a prediction, not your visitors' behavior, but it shows where to look first.
Read the click map as a ranked list
Contact pages are short, so the colors can make everything look hot. The ranking in the left panel tells you more. Sort the top clicked elements into five groups:
- Direct channels: phone numbers, email addresses, chat buttons
- Location: street address, map embed, "get directions" links, local office lists
- The form: each field, the submit button, any dropdowns such as "reason for contact"
- Self-serve routes: links to help center, FAQ, docs, order status, returns
- Ways out: the menu, the logo, footer links, social icons
Then ask what each group is telling you.
Clicks on plain-text contact details are the first thing to check. If your phone number or email is written as text, visitors who click or tap it get nothing back, and the click map shows a dead click. Switch Clarity to dead clicks and look at the phone number, the email address and the street address. A cluster on any of them means people tried to use it. The fix is quick: make phone numbers tap-to-call links, make email addresses mailto links (or add a copy button next to them), and link addresses to a map, as NN/g also recommends.
A busy phone number with a quiet form is not a problem with the form. It may just mean your visitors prefer to call, which matches what NN/g's participants said. Don't hide the number to push people into the form. Instead, check that the number is easy to tap on mobile, that your hours and time zone sit right next to it, and that you track the taps so the calls count as leads.
Clicks on the address or map can be healthy or a warning. For a local business, they're often the main goal. For a software company, heavy clicks on the address can mean visitors are checking whether you're a real company, which is a trust question your about page should help answer.
Clicks on self-serve links tell you what people really wanted. If a large share of contact page clicks go to "Order status" or "Help center," many visitors came with a support question. That's useful: put those links at the top so support visitors leave quickly, and keep sales enquiries from getting buried under them. If many of those clicks go to your FAQ, the FAQ page heatmap guide shows whether it answers them.
Rage clicks usually point to something that looks clickable and isn't, or that's slow. On contact pages that's often a dropdown that won't open on mobile, a map embed that captures the scroll, or a submit button that waits on a spam check. Use Clarity's "View recordings" option on that element to watch those sessions (Microsoft Clarity, Click maps).
Last clicks on the menu or logo are exits. If last clicks pile up there, people looked at the page and didn't find a way to contact you that they were willing to use. Check what they saw: was the only option a long form? Was there no phone number, or no reply time?
Then read the scroll map
Most contact pages are short enough that teams skip the scroll map. Don't, especially on mobile, where a hero image, a block of text and a map embed can push the actual contact details below the first screen.
Nielsen Norman Group's 2018 eyetracking study found that people spent about 57% of their page-viewing time above the fold, 74% in the first two screenfuls, and 81% in the first three (NN/g, Scrolling and Attention). On a contact page, the first screen is where your phone number, email and the start of the form should be.
Check three things:
- Where the average fold sits on mobile, and whether the contact options are above it. If a full-width map or a headline image takes the first screen, most phone visitors see a picture of a map and nothing to tap.
- What share of visitors reach the form. If the form is below the fold and the scroll map shows a steep drop before it, the form isn't failing. Most people never see it.
- Whether anyone reaches what sits under the form. Office lists, social links and FAQ blocks under a long form often get very little attention. Move the ones that matter, such as reply times, up next to the channels they describe.
A scroll map is also a useful check on GA4, because enhanced measurement fires its scroll event only the first time a visitor reaches 90% of the page (Google Analytics, Enhanced measurement events). That won't tell you whether people saw a form that starts at 40%.
If the map points at the form
When the heatmap shows that people reach the form but few submit, switch tools. Compare form_start with form_submit (or with generate_lead) for the same window. If many people start and few finish, the problem is inside the form: the number of fields, a field people don't want to fill in, a CAPTCHA, or an error message. Our guide to form abandonment analysis shows how to find the field where people stop, and lead gen form fields covers which fields to keep, cut or ask later.
If few people even start the form, the problem is usually before it: the form is below the fold, it looks long, or visitors would rather call or email. The heatmap is the right tool for that case.
What happens after someone submits matters too. A confirmation that says what happens next, and when, reassures people that the message arrived. Our guide to the lead form thank-you page covers what to put there.
Common mistakes reading contact page heatmaps
- Treating every contact visit as a sales lead. Many contact visitors are customers with support questions. If you count all of them in the same funnel, a support-heavy week looks like a sales drop. Separate them, or at least note the share of clicks on self-serve links.
- Hiding the phone number to push people into the form. NN/g found the opposite of what this assumes: users saw missing phone numbers as a sign that a company didn't want to be bothered. You'll lose trust, and some of those visitors will simply leave.
- Reading desktop and mobile together. A tap on a phone number usually starts a call on a phone, while desktop visitors are more likely to copy the number or switch to email. Mixed together, the map hides both patterns.
- Counting only form submits as leads. If many visitors tap to call or click mailto, and you only count form_submit, the page looks worse than it is. Track all the channels.
- Ignoring the link to the page. If the contact page gets few visits at all, the problem may be upstream. Check whether the contact link sits in your header or utility menu and in your footer, where NN/g's participants looked for it. The website navigation heatmap guide shows how to check whether people find it.
Turn one pattern into one change
Pick the single pattern that affects the most contact visitors and write it down as a hypothesis with a number you can re-check. For example (illustrative): "On mobile, dead clicks cluster on the plain-text phone number and email, and the form starts below the average fold. Make both links tappable, move them above the map embed, and compare tap-to-call clicks plus form_submit per contact page view over two equal weeks."
Our CRO hypothesis template gives you a format for writing these down. If the page doesn't get enough traffic for a proper A/B test, CRO without A/B testing shows how to compare a before-and-after honestly. If you'd rather not run that re-measurement by hand, every Cortality plan re-measures each fix you ship; compare the plans.
Contact page heatmap checklist (copy this)
- Contact page read on its own, not grouped with demo or quote pages
- Desktop and mobile read separately
- Large traffic sources (header link, support articles, ads) read on their own
- A few hundred contact page views per device in a fixed window
- Click ranking sorted: direct channels, location, form, self-serve, ways out
- Dead clicks checked on phone number, email address and street address
- Phone numbers are tap-to-call links, emails are mailto links or have a copy button
- Scroll map checked: contact options and the start of the form above the average fold on mobile
- Hours, time zone and reply time shown next to each channel
- generate_lead or form_submit, plus tap-to-call and mailto clicks, arriving as events
- One change shipped, re-measured over the same window length
Where Cortality fits
Most of this comes down to one question: what do visitors actually see, skip and tap on your contact page, and where do they give up? Cortality measures how real visitors use every part of your page, including the phone number, the email address, the form and each of its fields, on each device. You get a ranked list of fixes, each with the evidence and the exact change to make, and after you ship a fix Cortality re-measures it and tells you whether it worked. It works alongside Google Analytics and Microsoft Clarity rather than replacing them. See how it works or what a finding looks like. For software companies, see Cortality for SaaS.
For a quick first look, our free page leak scan takes about a minute and needs no install. It's a prediction from our attention model, not data from your real visitors, so use it to decide where to look first.
Plans are $99, $249 or $499 a month (Starter, Growth and Scale). Start your free week, and you see your first report before you pay. You save a card at signup, and nothing is charged until 3 days after your first report. Cancel before then and you pay nothing, and any charge can be refunded within 14 days. How the free week works.
Questions
What does a contact page heatmap show?
Where visitors click or tap on your contact page, how far they scroll, and which elements they click that don't respond. It shows whether people go for the phone number, the email address, the address or map, a chat button, or the form, and where they give up.
Why do people click the email address or phone number on my contact page?
Because they want to use it. If the phone number or email is plain text, a click does nothing, and the heatmap shows it as a dead click. Make phone numbers tap-to-call links and email addresses mailto links, or add a copy button, so the click does what the visitor expected.
Is a contact page heatmap the same as form analytics?
No. A heatmap shows where people click and how far they scroll on the whole page. Form analytics shows how people move through the fields of a form, which field they stop at, and how many submit. Use the heatmap to see whether people choose the form at all, and form analytics to see why started forms aren't finished.
How much traffic does a contact page heatmap need?
A few hundred contact page views per device in the window you're reading is a sensible minimum. Microsoft Clarity will draw a heatmap from any amount of traffic, but a map from a few dozen visits mostly shows those few people. If your contact page is quiet, read a longer window and watch a few session recordings alongside it.