Mobile vs Desktop Heatmaps: Why the Same Page Tells Two Different Stories
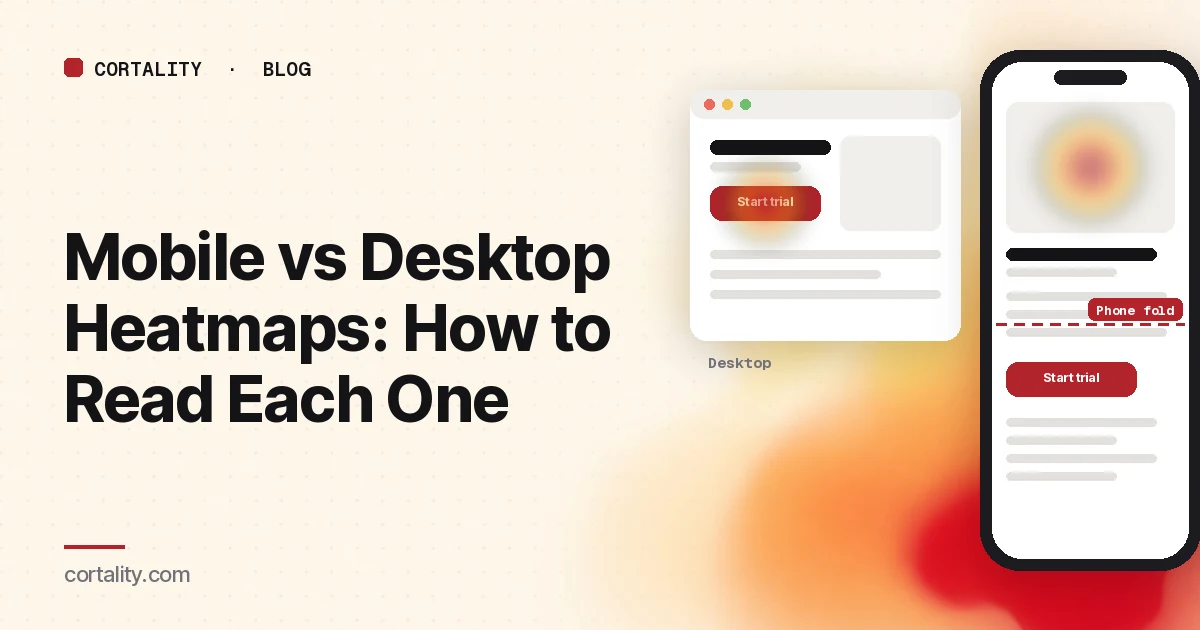
Open a heatmap for your landing page, switch from desktop to mobile, and it can look like a different site. The button that's hot on desktop is lukewarm on phones. A photo nobody touches on desktop is covered in taps. The fold is somewhere near the top of the hero.
That's not noise. It's the same content in a different layout, used with a finger, on a smaller screen, often in a shorter session. This guide covers why the two maps differ, how to read each one, the patterns that are specific to phones, and a side-by-side method for turning the gap into fixes.
Why the two maps differ
The layout changes. A responsive page reflows into one column on a phone. Sidebars move below the content, side-by-side cards stack, and the navigation collapses into a menu icon. An element that sits beside the headline on desktop may be two screens down on mobile.
The first screen holds much less. Nielsen Norman Group put it this way: the content shown above the fold on a 30-inch monitor takes 5 screenfuls on a small 4-inch screen (NN/g, Mobile User Experience: Limitations and Strengths). Phones are bigger now, but the point stands: on a phone, more of the page depends on scrolling.
Fingers aren't cursors. There's no hover on a touchscreen, and targets need to be bigger. NN/g recommends interactive elements of at least 1cm by 1cm, and notes that the average fingertip is 1.6 to 2cm wide (NN/g, Touch Targets on Touchscreens). Small or crowded targets cause slower taps and taps on the wrong thing.
Sessions are shorter and more interrupted. NN/g notes that attention on phones is often fragmented, and cites an average mobile session of 72 seconds against 150 seconds on desktop in its own studies (NN/g). That article is from 2015, so treat the exact numbers as dated, but the guidance holds: on mobile, put the gist before the detail.
The tool records different things. Microsoft Clarity, for example, tracks clicks on PCs and taps on mobile and tablet, and lets you switch between PC, Tablet and Mobile views of the same map (Microsoft Clarity, Click maps). Its scroll maps show an average fold, the point visible before visitors start scrolling (Microsoft Clarity, Scroll maps). That fold sits in a very different place on each device.
How to read the two maps side by side
1. Start with the device that brings most of your visitors
Check your analytics for the split. If most of your traffic is on phones, the mobile map is the main one and desktop is the comparison, not the other way around. Never merge the two to get more data: a combined map shows heat on positions that match neither layout. If you're short on traffic, our guide to heatmaps for low-traffic sites covers what you can still read.
2. Use the same page, date range and filters on both
Pick one URL and one date range with no page changes in the middle. Clarity's compare mode puts two maps side by side, each with its own filters (Microsoft Clarity blog, Compare mode), which makes it easy to keep everything the same except the device.
3. Compare the scroll maps first
Note where the average fold sits on each device and what percentage of visitors reach your main call to action. On desktop the button may be on the first screen. On a phone the same button may sit below the point where a large share of visitors stopped. Our guide to reading a scroll map covers the drop-off and false-floor patterns to look for.
4. Then compare the click maps, element by element
Read the ranked list of most clicked elements on each device, not just the colors. Write down your main call to action's share of clicks on each. A big gap between the two, with similar reach, points at something on the page rather than at the device. Our guide to reading a click map covers the ranked list and area totals.
5. Watch phone recordings for the biggest gaps
For each element where mobile and desktop differ a lot, watch five to ten mobile recordings of visitors who reached it. You're looking for the reason behind the number: a sticky bar covering the button, a menu that hides the link people want, a form field that opens the wrong keyboard. Our guide to analyzing session recordings covers what to note.
Patterns that show up mostly on phones
The main button below the phone fold
The most common one. On desktop, the call to action is visible on load. On mobile, the hero image, headline and a paragraph push it down, and the scroll map shows a big share of phone visitors leaving before they reach it. Shorten what sits above it on mobile, or repeat the button higher. Our guide to what to put above the fold covers what earns that space.
Taps on images and text that aren't links
On phones, visitors tap product photos to enlarge them, tap plan names to see details and tap bold text that looks like a link. These show up as heat on elements that do nothing. Either make the element do what visitors expect or make it look less tappable and add a clear link beside it.
Heat spread across small, crowded controls
Size buttons, color swatches, quantity steppers and stacked links often show scattered taps around and between the targets. That's a sign of missed taps. NN/g describes this as view-tap asymmetry: elements big enough to see but too small or crowded to tap accurately, often left over from a desktop design (NN/g). As a floor, WCAG 2.2 asks for pointer targets of at least 24 by 24 CSS pixels, or enough spacing around smaller ones (W3C, Understanding Target Size (Minimum)). For important controls, aim well above that.
Heavy taps on the menu icon
On desktop, the main links are visible. On mobile, they hide behind a menu icon. A hot menu icon on a landing page usually means phone visitors are looking for something the page doesn't show them, often pricing, delivery or what happens after signup. Bring that answer into the page.
Repeated taps on one element
Rapid taps in one spot often mean the element is slow to respond on a phone, or nothing visible happens after a tap. Our guide to rage clicks and dead clicks covers the causes worth checking.
Desktop hover heat with no phone equivalent
Desktop move or attention maps include cursor movement. Phones have no cursor. If your desktop map shows visitors hovering over a tooltip or a menu that reveals information, phone visitors are missing that information completely. Make anything important visible without hover.
Mistakes that mislead
- Merging devices. The combined map matches no real layout.
- Treating tablet as mobile. Clarity reports tablet separately. Depending on your breakpoints, a tablet may get the desktop layout, the phone layout or something in between.
- Using a desktop screenshot for phone heat. Check that the screenshot under the map matches the layout phone visitors saw.
- Judging a phone element without checking reach. Read the mobile scroll map before the mobile click map.
- Comparing raw clicks. If 70% of visits are on phones, mobile will have more clicks everywhere. Compare shares and reach, not totals.
- Acting on a tiny sample. Device splits shrink your data. A map built from a few dozen views is a hint to check.
From the gap to a fix you can check
For each difference you plan to act on, write one line: device, what you saw, the likely cause, the change, and the number you'll compare. For example: "On mobile, 31% of visitors reach the Start trial button against 88% on desktop. Move the button above the hero image on mobile only. Compare mobile clicks on Start trial before and after, two weeks each." Those numbers are illustrative. Use your own.
Then check the fix on a real phone, not only a resized browser window, before you ship it. If your phone visitors convert worse overall, our guide to low mobile conversion rates covers speed, tapping, finding and form checks beyond the heatmap.
Where Cortality fits
A heatmap shows mobile and desktop as two separate pictures. Cortality goes element by element: one tag measures how real visitors use every part of your page, including what they see, skip, tap and stop at, on each device. You get a ranked list of fixes, each with the evidence and the exact change to make, and after you ship a fix Cortality re-measures it and tells you whether it worked. It works alongside Google Analytics and Microsoft Clarity rather than replacing them. See how it works or what a finding looks like.
For a quick first look, our free page leak scan takes about a minute and needs no install. It's a prediction from our attention model, not data from your real visitors, so use it to decide where to look first.
Plans are $99, $249 or $499 a month (Starter, Growth and Scale). Start your free week, and you see your first report before you pay. You save a card at signup, and nothing is charged until 3 days after your first report. Cancel before then and you pay nothing, and any charge can be refunded within 14 days. How the free week works.
Questions
Why does my mobile heatmap look different from my desktop heatmap?
Because it's a different page. On a phone, the layout collapses into one column, elements move down, menus hide behind an icon and the first screen shows far less. Visitors tap with a finger instead of pointing with a cursor. So clicks, scroll depth and the fold all land in different places.
Should I combine mobile and desktop heatmaps?
No. A combined map blends two layouts into one picture, so heat ends up on positions that don't match what either group saw. Read each device on its own, starting with the one that brings most of your traffic.
Do mobile heatmaps show hover or mouse movement?
No. Phones have no cursor, so there's nothing to hover. Mobile maps are built from taps and scrolling. Treat a desktop move or hover map and a phone map as different kinds of evidence, not two views of the same thing.
What should I look for first on a mobile heatmap?
Where the main call to action sits compared with how far most phone visitors scroll, then taps on things that aren't links, then taps clustered on small or crowded controls. Those three account for many of the fixes that are specific to phones.