How to Read a Click Map: What Visitors Click, What They Miss, and What to Change
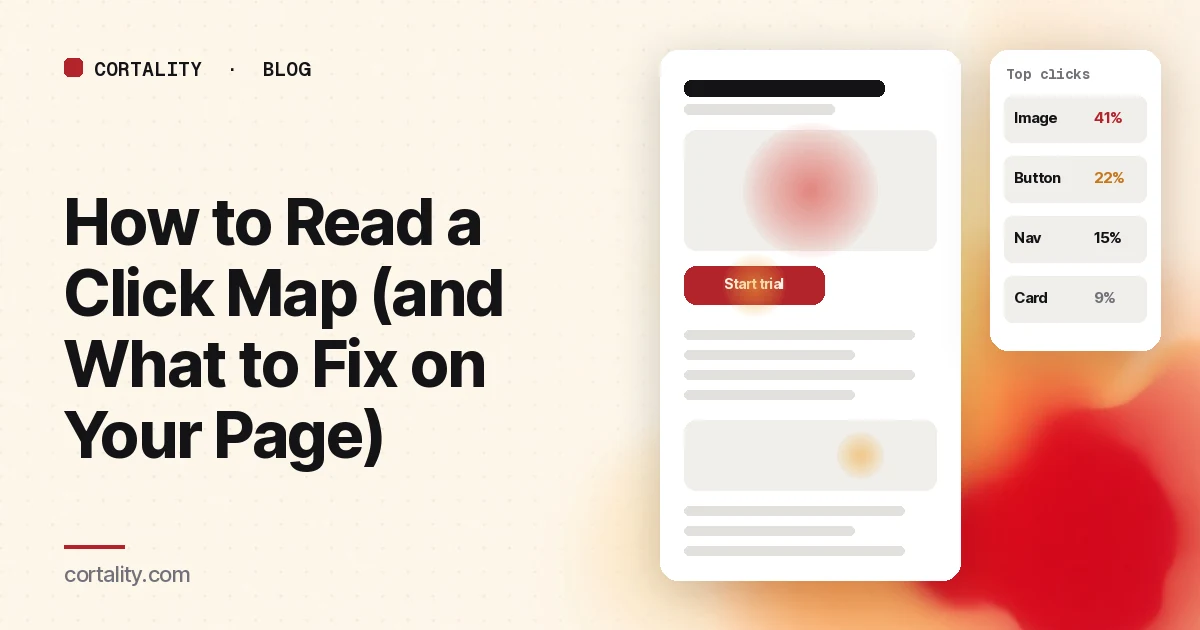
A click map looks like the most direct evidence you'll ever get: here is where people clicked. It's easy to read too much into it. A cold button might be a bad button, or it might sit below the point where most visitors stopped scrolling. A hot image might be a sign of interest, or of visitors trying to do something the page won't let them do.
This guide covers what a click map measures, how to read one in five steps, the patterns worth acting on, and how to turn a pattern into a change you can check.
What a click map measures
A click map adds up clicks (on desktop) and taps (on phones and tablets) across many page views and shows them as color on a screenshot of the page. Warmer means more clicks. Microsoft Clarity's version, for example, ranks elements by number of clicks with each one's share of all clicks, includes clicks on things that aren't links, and lets you switch to views of only dead clicks, rage clicks, clicks just before a JavaScript error, first clicks and last clicks (Microsoft Clarity, Click maps).
Three limits are worth knowing before you start:
- It counts clicks, not intent. A click on a link that led nowhere useful looks the same as a click that led to a sale.
- It only counts what visitors reached. An element can't get clicks from people who never scrolled to it.
- The screenshot may not match what visitors saw. Pages with sliders, pop-ups or personalized content change between visits. Clarity notes that the page snapshot may not show the element a visitor actually clicked (Microsoft Clarity).
How to read a click map in 5 steps
1. Pick one page, one device and one date range
Mobile and desktop layouts differ, so their clicks land in different places. Look at each separately. Our guide to mobile vs desktop heatmaps covers the patterns that show up mostly on phones. Pick a date range with no big changes to the page in the middle of it.
2. Check the scroll map first
Before you judge any element by its clicks, check how many visitors reached it. Our guide to reading a scroll map covers how. A low-click button below the main drop-off is a placement problem. A low-click button that almost everyone saw is a different problem.
3. Read the ranked list, not just the colors
Color is relative to the rest of the page, so a page with one very hot element can make everything else look cold. The ranked list of elements with their share of clicks is easier to compare. Write down the top ten and where your main call to action sits on that list.
4. Group elements into areas
Individual elements can hide a pattern. Clarity's area maps let you draw a region, like the whole navigation or a pricing table, and see its click-through rate as a share of all clicks on the page (Microsoft Clarity, Area maps). If the navigation takes more clicks than the main call to action on a landing page, that's worth knowing even if no single nav link stands out.
5. Watch recordings for the top surprises
A click map tells you what happened. Recordings show why. For each surprising element, watch five or ten recordings of visitors who clicked it. Clarity links straight from a clicked element to recordings of sessions where it was clicked (Microsoft Clarity). Our guide to analyzing session recordings covers what to look for.
The patterns worth acting on
1. Clicks on things that aren't links
Images, headings, icons, plan names and bold text attract clicks when they look clickable or when visitors want more. Decide which way to fix it: make the element do what visitors expect (enlarge the image, link the plan name to details), or make it look less like a link and put a clear link next to it.
2. A main call to action that people saw but didn't click
If the scroll map says most visitors reached the button and the click map says few clicked it, look at the button itself: is it clear what happens next, does it look like a button, and is anything louder competing with it? Our guide to CTA button placement separates reach problems from clarity problems. Nielsen Norman Group found that pages with weak clickability signals, such as ghost buttons or links styled like plain text, took people 22% longer to find the right thing to click, with 25% more fixations, in an eyetracking study of 71 users (NN/g, Flat UI Elements Attract Less Attention and Cause Uncertainty). On one page in that study, 9 of 24 people who saw the weak version stopped at a heading they assumed was clickable and never looked at the real link.
3. Navigation or footer links soaking up clicks
On a landing page, every click that goes elsewhere is a click that didn't go to the offer. Heavy clicks on "Pricing", "About" or "FAQ" usually mean visitors are looking for information the page doesn't give them. Bring the missing answer onto the page before you think about removing the link.
4. Repeated clicks in one spot
Rapid clicks on the same element usually mean it's slow, broken, or doesn't show that anything happened. Use the rage click and dead click views to find these. Our guide to rage clicks and dead clicks covers the seven causes worth checking.
5. First clicks going the wrong way
The first click on a page is a strong signal. In usability research summarized by Jeff Sauro, people whose first click was on the right path went on to succeed 87% of the time, against 46% when the first click went down the wrong path (MeasuringU, Getting the First Click Right). If the first-click view shows most visitors heading for something other than your main path, that's a high-priority finding.
6. Clicks on form fields that stop
Lots of clicks on the first field of a form and few on the last means visitors start and give up. The click map shows where the form starts losing people. Our guide to form abandonment analysis covers how to find the field that's causing it.
Mistakes that mislead
- Judging a cold element without checking reach. Always look at the scroll map first.
- Mixing devices. A hot spot on desktop can be a dead zone on a phone.
- Reading a busy page by color alone. Use the ranked list and area totals.
- Treating clicks as success. A click that leads to a dead end is a problem, not a win.
- Acting on a few dozen views. Small samples move a lot. Treat them as hints.
- Ignoring page changes. If the page changed during your date range, the map blends two pages.
From click map to a fix you can check
For each pattern you plan to act on, write one line: what you saw, what you think causes it, the change, and the number you'll compare afterward. For example: "On mobile, 18% of clicks land on the product photo, which doesn't enlarge. Make the photo open a gallery. Compare clicks on Add to cart before and after, same weekdays, two weeks each." The numbers in that example are illustrative. Use your own.
When you have more fixes than time, rank them. Our guide to prioritizing CRO ideas compares the common scoring frameworks and gives a simple one to copy.
Where Cortality fits
A click map tells you what visitors clicked. Cortality goes element by element: one tag measures how real visitors use every part of your page, including what they see, skip, tap and stop at, on each device. You get a ranked list of fixes, each with the evidence and the exact change to make, and after you ship a fix Cortality re-measures it and tells you whether it worked. It works alongside Google Analytics and Microsoft Clarity rather than replacing them. See how it works or what a finding looks like.
For a quick first look, our free page leak scan takes about a minute and needs no install. It's a prediction from our attention model, not data from your real visitors, so use it to decide where to look first.
Plans are $99, $249 or $499 a month (Starter, Growth and Scale). Start your free week, and you see your first report before you pay. You save a card at signup, and nothing is charged until 3 days after your first report. Cancel before then and you pay nothing, and any charge can be refunded within 14 days. How the free week works.
Questions
What does a click map show?
Where visitors clicked or tapped on a page, added up across many visits. Warmer colors mean more clicks. Most tools also list the most clicked elements with their share of all clicks, and many include clicks on things that aren't links, which is often the most useful part.
What's the difference between a click map and a scroll map?
A scroll map shows how far down the page visitors got. A click map shows what they clicked once they were there. Read the scroll map first: an element with no clicks below the point where most visitors stopped tells you about its position, not about the element.
Why are people clicking on things that aren't links?
Usually because the thing looks clickable or because visitors expect more from it: an image they want to enlarge, a heading that looks like a link, a plan name they want details on. Decide whether to make it clickable, or make it look less like a link and add a clear link next to it.
How many visitors do I need for a click map?
Enough that a handful of sessions don't change the picture. Look at mobile and desktop separately, because the layout differs, and treat a map built from a few dozen page views as a hint to check, not a finding.