CRO Prioritization Framework: How to Decide What to Fix or Test First
Any honest look at a website produces more ideas than anyone has time for. A new headline, a shorter form, reviews closer to the button, a different hero image, a fix for the thing that's broken on Safari. The question isn't whether to prioritize. It's how to stop the ranking from turning into whoever argues loudest.
This guide compares the three frameworks you'll see most, PIE, ICE and PXL, explains where each goes wrong, and ends with a simple evidence-first scorecard you can copy for a landing page.
First, take the bugs out of the list
Some items aren't ideas. A form that errors on mobile, a button hidden behind a cookie banner, a broken link in the main path. These don't need scoring or testing. Fix them, check they're fixed, and keep them out of the backlog so they don't distort the ranking. Our guide to CRO without A/B testing covers this first step in more detail.
PIE: Potential, Importance, Ease
PIE scores each idea, usually from 1 to 10, on three questions (CXL, PXL: A Better Way to Prioritize Your A/B Tests):
- Potential: how much improvement can be made on this page?
- Importance: how valuable is the traffic to this page?
- Ease: how complicated will the change be to build?
Its strength is that Importance ties the score to real traffic. Its weakness, in CXL's words, is that the criteria leave "way too much open to interpretation." If you knew in advance how much potential an idea had, you wouldn't need a framework, and anyone keen on an idea can add a couple of points to Potential.
ICE: Impact, Confidence, Ease
ICE, popularized by GrowthHackers founder Sean Ellis, scores (CXL):
- Impact: what will the impact be if this works?
- Confidence: how confident are you that it will work?
- Ease: how easy is it to build?
It's quick and it's everywhere. The same criticism applies, more strongly: two of the three scores are largely gut feeling. CXL also describes a second version of ICE (Impact, Cost, Effort) scored only 1 or 2, high or low. The smaller scale avoids everything drifting to the middle, but many ideas end up tied (CXL).
PXL: yes-or-no questions instead of ratings
CXL built PXL to take as much opinion out of the score as possible. Instead of asking "how big is the impact?", it asks specific questions, mostly scored 0 or 1, with extra weight on a few (CXL):
- Visibility: Is the change above the fold? Is it noticeable within 5 seconds? Does it add or remove something, rather than just restyle it?
- Traffic: Does it run on a high-traffic page?
- Evidence: Does it address a problem found in user testing? In surveys, polls or interviews? Is it supported by heatmaps or eye tracking? By analytics?
- Ease: How long will it take to build, in time brackets rather than a vague rating?
Two points in the CXL write-up are worth keeping whatever you use. A high score doesn't predict a win: it only says the idea is a stronger candidate. And the framework is meant to be customized, for example by adding a question for brand rules or for not hurting SEO.
Comparing the three
| PIE | ICE | PXL | |
|---|---|---|---|
| What it scores | Potential, Importance, Ease | Impact, Confidence, Ease | Visibility, traffic, evidence, ease |
| Scale | Usually 1 to 10 | Usually 1 to 10 | Mostly 0 or 1, some weighted |
| Rewards evidence? | Not directly | Only through "confidence" | Yes, one point per source |
| Easy to inflate? | Yes | Yes | Harder |
| Best for | Choosing which pages to work on | Quick team triage | Ranking specific ideas |
A simple scorecard for one landing page
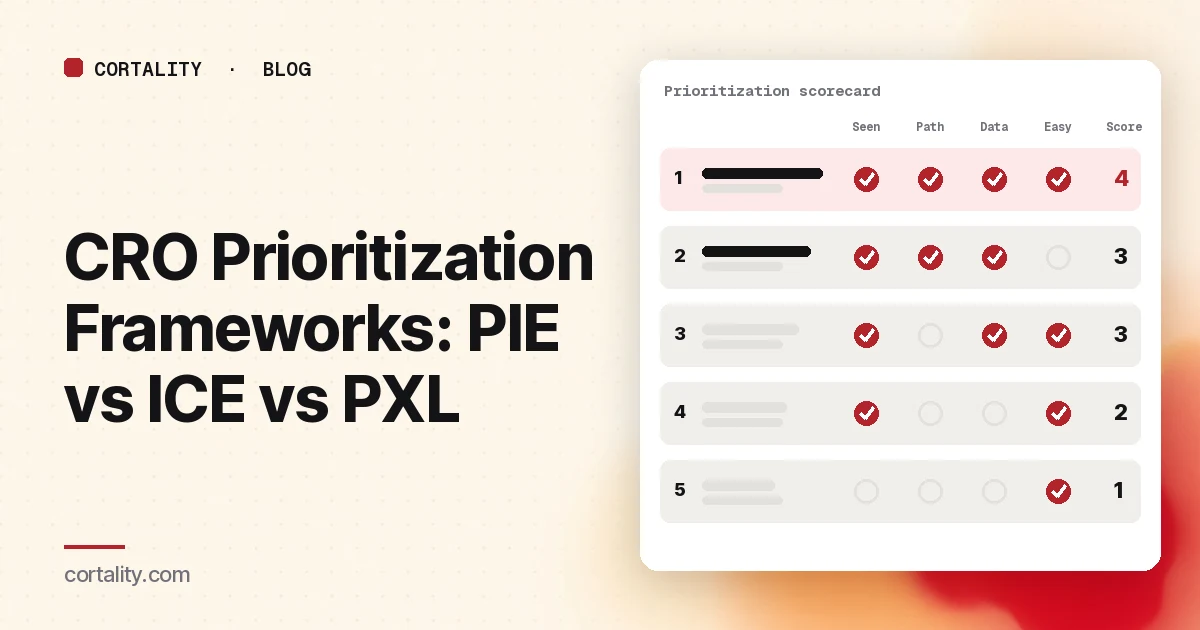
For a small team working on one page, a trimmed PXL-style scorecard is usually enough. Give each idea one point per "yes":
- Most visitors see the part of the page it changes (check the scroll map).
- It's on the main path to the conversion, not in the footer or a side link.
- A visitor would notice the change within a few seconds.
- It adds missing information or removes a distraction, rather than restyling.
- Behavior data points to it: a click map, scroll map or recordings.
- A second, independent source points to it: analytics, a survey answer, a support ticket, a sales call.
- It can be built in a day or less.
Sort by score. Break ties by how close the change sits to the main call to action. Then do the top few, one at a time, and measure each.
A worked example, with illustrative scores: "Move the review count next to the button on mobile" gets 6 (seen by most, main path, noticeable, adds information, recordings show visitors scrolling to find reviews, two support emails ask if the product is legit, built in an hour, but no analytics signal). "Change the hero image" gets 2 (seen by most, noticeable, no evidence). The first goes first.
The evidence questions are where the scorecard earns its keep. Nielsen Norman Group makes the same point about UX findings: a problem should never be called a problem just because the reviewer doesn't like it (NN/g, UX Expert Reviews). Ideas that come only from opinion should score low, as CXL puts it (CXL).
Mistakes that break any framework
- Scoring alone. Have two or three people score separately, then compare. Nielsen Norman Group warns that severity ratings from a single evaluator are unreliable (NN/g, Severity Ratings for Usability Problems), and the same logic applies to idea scores.
- Re-scoring until the favorite wins. Agree the questions first, then score.
- Mixing bugs and ideas. Fix bugs outside the framework.
- Ignoring traffic. A small lift on a page with a lot of traffic is worth more than a big lift on a page few people see.
- Never closing the loop. Record what you shipped and what happened, and use it to check whether high scores actually did better.
Where the ideas come from
A framework only ranks the list you give it. If the list is built from opinions, the top of the ranking will be too. Start from an audit: our website UX audit checklist covers what to look at, and our UX audit report template shows how to write each finding with its evidence and severity so it drops straight into a scorecard. For evidence from behavior, our guide to reading a click map covers which patterns are worth turning into ideas. To write each idea as something you can test, use our CRO hypothesis template.
Where Cortality fits
Most of the work in prioritizing is gathering evidence. Cortality does that part: one tag measures how real visitors use every part of your page, element by element, including what they see, skip, tap and stop at, on each device. You get a ranked list of fixes, each with the evidence and the exact change to make, and after you ship a fix Cortality re-measures it and tells you whether it worked. It works alongside Google Analytics and Microsoft Clarity rather than replacing them. See how it works or what a finding looks like.
For a quick first look, our free page leak scan takes about a minute and needs no install. It's a prediction from our attention model, not data from your real visitors, so use it to decide where to look first.
Plans are $99, $249 or $499 a month (Starter, Growth and Scale). Start your free week, and you see your first report before you pay. You save a card at signup, and nothing is charged until 3 days after your first report. Cancel before then and you pay nothing, and any charge can be refunded within 14 days. How the free week works.
Questions
What is a CRO prioritization framework?
A consistent way to score and rank conversion ideas, so the team works on the ones most likely to matter first instead of the loudest opinion. Common ones are PIE (Potential, Importance, Ease), ICE (Impact, Confidence, Ease) and CXL's PXL, which replaces broad ratings with yes-or-no questions about evidence, visibility, traffic and effort.
What's the difference between PIE and ICE?
Both score three things and both include Ease. PIE asks how much a page could improve (Potential) and how valuable its traffic is (Importance). ICE asks what the impact would be if the idea works and how confident you are that it will. CXL's criticism of both is that those ratings are guesses that are easy to inflate.
Which prioritization framework is best?
The one your team will apply the same way every time. For most small teams, a short yes-or-no scorecard that rewards evidence, like PXL or a trimmed version of it, works better than 1 to 10 ratings, because it's harder to nudge a score up for a pet idea.
Do I need A/B testing to use a prioritization framework?
No. The same scoring works for deciding which fixes to ship and measure before and after. Clear bugs, like a broken form, shouldn't go through scoring at all. Fix them first.