UX Audit Report Template: How to Write Findings People Actually Fix
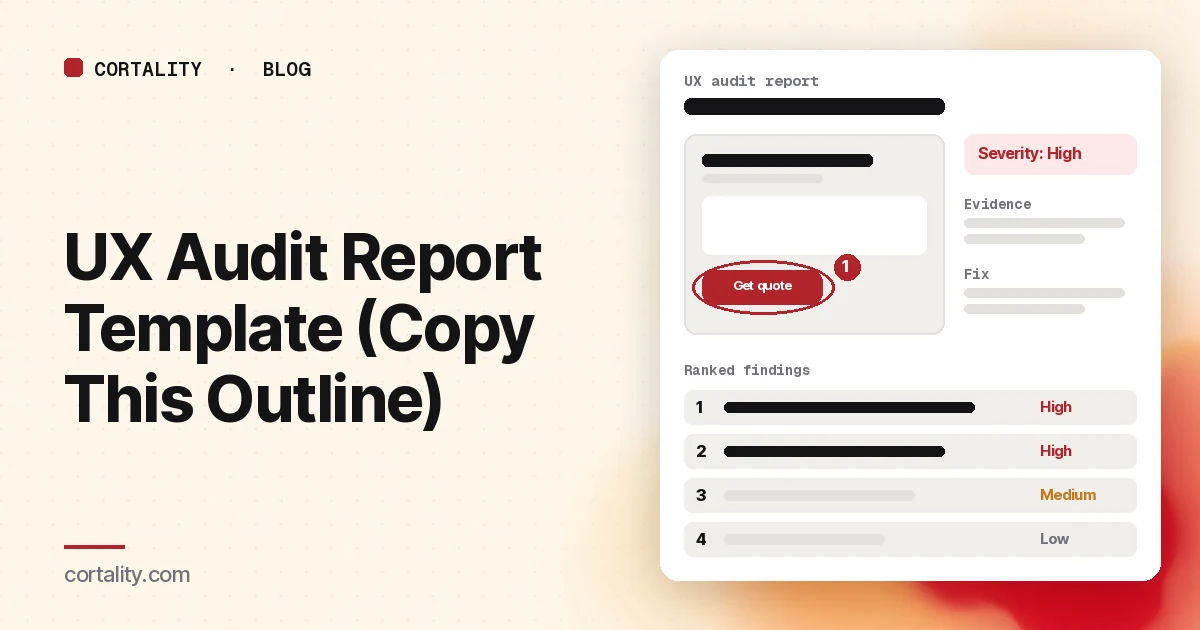
The audit is the easy part. The hard part is the report: getting someone who wasn't in the room to understand what's wrong, believe it, and fix the right things first. Plenty of careful audits end as a 60-slide deck that gets skimmed once and filed.
This guide gives you a section-by-section template, a format for writing each finding, a simple way to rate severity, and the mistakes that get reports ignored. If you still need to do the audit itself, start with our website UX audit checklist and come back here to write it up.
What a good report does
A UX audit report has one job: turn observations into decisions. Nielsen Norman Group lists the core parts of an expert review as a list of strengths, a list of problems mapped to where they occur, a severity rating for each problem, a recommendation for fixing each one, and examples of good practice to guide the fix (NN/g, UX Expert Reviews). Every section in the template below serves one of those.
The same article makes a point worth putting at the top of your own process: a design element should never be called a problem because the reviewer doesn't like it. Each problem needs an objective explanation, grounded in a principle, research or evidence.
The template, section by section
1. One-page summary
The top three to five findings, each in one sentence, with severity and the recommended fix. Then one line on what to do first. Write this last, and assume it's the only page some readers will see.
2. Scope and method
Which pages, journeys and devices you looked at, the dates, and what evidence you used: an expert review against heuristics, analytics, heatmaps, session recordings, user tests. Say what was out of scope. This is the section that stops "but did you look at checkout?" a week later.
Narrow scopes produce better reports. Nielsen Norman Group suggests narrowing a heuristic evaluation to one task, one section, one user group or one device type at a time (NN/g, How to Conduct a Heuristic Evaluation).
3. What already works
A short list of strengths, each with a sentence on why it works. It isn't there to soften the blow. It stops a redesign from throwing out the parts of the page that are doing their job (NN/g).
4. Findings
The body of the report: one finding per page or slide, in the format below, ordered by priority rather than by where they appear on the page.
5. Prioritized plan
A short table: finding, severity, effort (small, medium, large), owner, and the order to do them in. High-severity, small-effort fixes go first.
6. How you'll check each fix
For every fix, the number you'll compare before and after, on which device, over what period. Without this, the next report can't say whether the last one worked. Our guide to proving CRO results to clients covers how to make that comparison hold up.
7. Appendix
Raw notes, the full list of minor issues, screenshots that didn't make the main findings, and links to the recordings or maps you used.
How to write each finding
Use the same six parts for every finding, so readers learn the format once:
- Title. What's wrong, in plain words: "Mobile visitors can't see the price before the form."
- Where. Page, element and device, with an annotated screenshot.
- Evidence. What you saw and how you know: the heuristic or principle it breaks, plus any behavior data. "41% of mobile visitors reach the form; recordings show visitors scrolling up and down looking for a price" is evidence. "Feels cluttered" isn't.
- Why it matters. The effect on the visitor and on the business goal of the page.
- Severity. From your scale (below).
- Recommendation. The specific change, and an example of a site that handles it well where you can. Nielsen Norman Group suggests showing more than one example, so nobody concludes there's only one right design (NN/g).
If you're not sure of the fix, say so and recommend how to find out: a usability test, a closer look at recordings, or a before-and-after test.
The numbers in the example above are illustrative. Use your own, and say where each came from.
How to rate severity
Pick a scale, define it in the report, and use it the same way every time. Two common options:
- Jakob Nielsen's 0 to 4 scale. 0: not a usability problem. 1: cosmetic, fix only if there's time. 2: minor, low priority. 3: major, important to fix, high priority. 4: usability catastrophe, fix before anything else (NN/g, Severity Ratings for Usability Problems).
- High, Medium, Low. Nielsen Norman Group often uses this simpler three-point scale in expert reviews (NN/g). It's easier for non-designers to read.
Whichever you use, Nielsen describes severity as a combination of three factors: how often the problem occurs, how hard it is to overcome, and whether it keeps bothering people or only trips them once (NN/g). For a landing page, add a fourth: how close the problem sits to the main conversion. A confusing footer link and a confusing button label can break the same principle and matter very differently.
One more caution from the same source: severity ratings from a single evaluator are unreliable. If you can, have two or three people rate each finding independently and use the average. Nielsen Norman Group likewise recommends three to five independent evaluators for a heuristic evaluation (NN/g).
Mistakes that get reports ignored
- Opinions dressed as findings. If you can't point to a principle or to evidence, leave it out or mark it as a question to test.
- Fifty findings, all equal. A long unranked list tells the reader you didn't decide. Put the minor issues in the appendix.
- No location. "The forms are confusing" can't be assigned to anyone. Name the page, the field and the device.
- Recommendations nobody can build. "Improve trust" isn't a task. "Move the review rating and count next to the button on mobile" is.
- No way to check. If the report doesn't say how each fix will be measured, nobody will know which ones worked.
- Desktop screenshots only. If most visitors are on phones, show the phone.
Adding behavior data to the report
An expert review finds likely problems. Behavior data shows which ones real visitors actually hit, and how often. Nielsen Norman Group is clear that heuristic evaluations can't replace research with real users (NN/g). For a live site, the quickest sources are analytics, scroll maps and session recordings. Our guides to reading a scroll map and analyzing session recordings cover how to turn each into evidence for a finding.
If you're pricing an audit for a client or comparing quotes, our guide to what a CRO audit costs covers what's usually included.
Where Cortality fits
Cortality produces the behavior-data half of this report for you. One tag measures how real visitors use every part of your page, element by element, including what they see, skip, tap and stop at, on each device. You get a ranked list of fixes, each with the evidence and the exact change to make, and after you ship a fix Cortality re-measures it and tells you whether it worked. It works alongside Google Analytics and Microsoft Clarity rather than replacing them. See what a finding looks like or how it works. If you audit client sites, see Cortality for agencies.
For a quick first look, our free page leak scan takes about a minute and needs no install. It's a prediction from our attention model, not data from your real visitors, so use it to decide where to look first.
Plans are $99, $249 or $499 a month (Starter, Growth and Scale). Start your free week, and you see your first report before you pay. You save a card at signup, and nothing is charged until 3 days after your first report. Cancel before then and you pay nothing, and any charge can be refunded within 14 days. How the free week works.
Questions
What should a UX audit report include?
A one-page summary of the top findings, the scope and method, what already works, a list of problems each with evidence, a severity rating and a recommended fix, a short prioritized plan, and how you'll check whether each fix worked. Nielsen Norman Group lists strengths, problems mapped to where they occur, severity ratings, recommendations and examples as the core parts of an expert review.
How do you rate the severity of UX issues?
Use a short scale and apply it the same way every time. Jakob Nielsen's classic scale runs from 0 (not a usability problem) to 4 (usability catastrophe), and severity combines how often the problem occurs, how hard it is to get past, and whether it keeps bothering people. Nielsen Norman Group often uses a simpler High, Medium, Low scale in expert reviews.
How long should a UX audit report be?
As short as it can be while still showing the evidence for each finding. The summary should fit on one page, because that's often the only part a decision-maker reads. Put the detail for each finding behind it, one finding per page or slide.
What's the difference between a UX audit and a heuristic evaluation?
A heuristic evaluation checks a design against a set of guidelines, such as Jakob Nielsen's 10 usability heuristics. A UX audit or expert review usually goes further, drawing on other research and on behavior data from real visitors, such as analytics, heatmaps and recordings. The report format below works for either.