How to Read a Scroll Map: Find Where Visitors Stop, Why, and What to Move
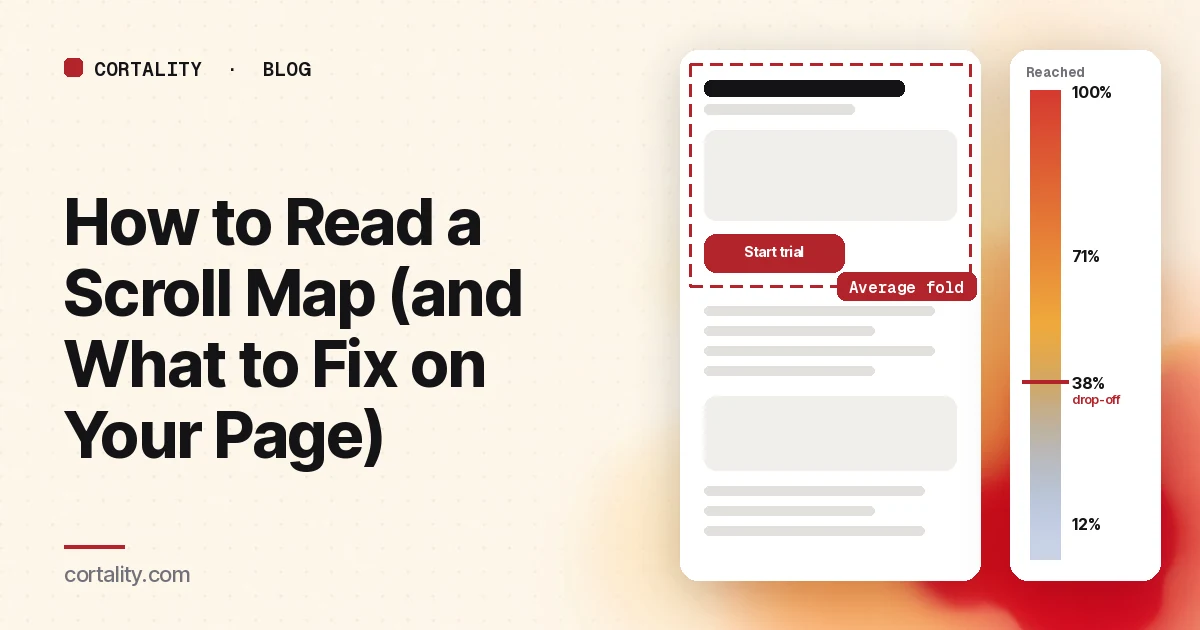
A scroll map is the simplest map in any heatmap product and the one most people read too fast. It answers one question well: how far down the page did visitors get? It doesn't tell you why they stopped, and it doesn't tell you whether stopping was bad.
This guide covers what a scroll map is actually measuring, how to read one in five steps, the shapes worth acting on, what a good scroll depth looks like, and how to turn a drop-off into a change you can check.
What a scroll map measures
A scroll map colors your page by the share of visitors who reached each point. Microsoft Clarity, for example, lists scroll data in 5% steps of page height, with the number of visitors and the share who dropped off at each step, and lets you hover anywhere on the map to see the exact percentage that reached that point (Microsoft Learn, Clarity scroll maps). Clarity also marks the average fold: the average point visitors could see before they started scrolling.
Two things the map does not measure:
- Attention. Reaching a section is not the same as reading it. A visitor can flick past your pricing table in half a second.
- Intent. A visitor who stops at your sign-up button and clicks it looks the same on a scroll map as one who stops there and closes the tab.
Keep both in mind and the map becomes very useful. Forget them and it will send you to fix the wrong thing.
How to read a scroll map in 5 steps
1. Split by device before you look
The same page is a different length on a phone and a laptop, because columns stack on narrow screens. A combined map averages two different pages into one meaningless line. Pick the device most of your traffic uses and read that map first. Our guide to how long a homepage should be on mobile shows how much longer a page gets on a phone.
2. Find the average fold
Everything above the average fold is what most visitors saw without doing anything. Check what sits there: the headline, the main call to action, one piece of proof. If the main button is below the average fold on mobile, that alone is a finding. Our checklist of what to put above the fold on a landing page covers what that first screen needs to hold.
3. Mark your key elements on the map
Before you look at the curve, write down where your important elements sit: the main call to action, the price, the strongest proof, the form. Then read the scroll percentage at each. "62% of mobile visitors reached the pricing section" is something you can act on. "The map goes blue around the middle" isn't.
4. Find the steepest drops
Look for places where the percentage falls much faster than the sections around it. A gentle decline is normal on any page: attention thins as you go down. In Nielsen Norman Group's 2018 eyetracking study, about 57% of page-viewing time went to the first screenful, about 74% to the first two, and people rarely went beyond the third (NN/g, Scrolling and Attention). That study used desktop screens, but the shape is the one to expect. A sudden cliff is different, and it's the thing to investigate.
5. Pair it with clicks and recordings
A drop on its own is ambiguous. Look at the click map for the section just above it: are visitors clicking the button there (they found what they needed) or clicking nothing (they gave up)? Then watch a few recordings of visitors who left at that point. Our guide to analyzing session recordings covers how to filter to the right ones.
The 5 shapes worth acting on
1. The cliff right after the first screen. A large share of visitors never scroll at all. Either the first screen answered them (check clicks on the main button) or it didn't give them a reason to keep going. Look at the headline and whether the page visibly continues.
2. The false bottom. A sharp drop just after a full-width image, a strong horizontal line, a big white gap or an ad. Nielsen Norman Group calls this the illusion of completeness: when the visible screen looks finished, people don't scroll. In one of their studies, six of eight users didn't realize they could scroll a page whose hero video filled the screen (NN/g, The Illusion of Completeness). The fix is to let the next section peek into view and shrink the gap.
3. Key content below the drop-off. Your best proof, the price or the form sits where only a small share of visitors get. The fix is usually to move it up, or to repeat the call to action higher.
4. A plateau, then a fall. Visitors keep scrolling through a long stretch and then leave at the same point. Look at what sits right there. A section that asks for something too early (a long form, a phone number, a price shock) often causes it.
5. A slow, even fade to the bottom. No single problem section, just a page that is longer than visitors' interest. Cut or merge sections, and put the call to action after each block that answers a main objection, so visitors who are ready don't need to reach the end.
What is a good scroll depth?
There's no benchmark worth chasing, because page length and purpose vary too much. A short sign-up page can have low average depth and convert well, because the decision happens on the first screen. A long sales page for an expensive product needs visitors to get much further.
A better question for each page: what share of visitors reach the main call to action and the proof that supports it? If that share is high, the rest of the page can fade without hurting you. If it's low, that's your first fix.
If you only have Google Analytics 4, its enhanced measurement scroll event fires the first time a visitor reaches 90% of the page's depth (Google Analytics Help). That tells you how many reach the bottom, not where the rest stopped. To see the drop-off points you need scroll events at more depths, set up in Google Tag Manager, or a scroll map.
Mistakes that mislead
- Reading a combined desktop and mobile map. Covered above, and the most common one.
- Treating low depth as failure. If visitors stop at the button because they clicked it, the page worked.
- Reading a map built from a handful of views. One curious visitor scrolling to the footer can make the bottom look busy. Wait for enough views that the curve stops jumping when new ones arrive.
- Mixing page versions. If the page changed during the date range, the map blends two layouts. Set the date range to start after the last change.
- Forgetting banners and pop-ups. A cookie banner or sign-up pop-up that covers the first screen changes where people stop. Check the page as a first-time visitor sees it.
Turn a drop-off into a fix you can check
Write each finding in one line: the page, the device, the element, the share of visitors who reach it, and the change you'll make. For example: "Pricing page, mobile: 38% reach the plan table; move a short plan summary and button above the testimonials." After the change ships, compare the share who reach and click that element on the same device, over a similar period, before and after. If you're writing these up for a client or a team, our UX audit report template shows a format that keeps the evidence next to each fix.
For the other map types and how to read them together, see how to read a website heatmap.
Where Cortality fits
A scroll map tells you how far visitors got. Cortality goes element by element: one tag measures how real visitors use every part of your page, including what they see, skip, tap and stop at, on each device. You get a ranked list of fixes, each with the evidence and the exact change to make, and after you ship a fix Cortality re-measures it and tells you whether it worked. It works alongside Google Analytics and Microsoft Clarity rather than replacing them. See how it works or what a finding looks like.
For a quick first look, our free page leak scan takes about a minute and needs no install. It's a prediction from our attention model, not data from your real visitors, so use it to decide where to look first.
Plans are $99, $249 or $499 a month (Starter, Growth and Scale). Start your free week, and you see your first report before you pay. You save a card at signup, and nothing is charged until 3 days after your first report. Cancel before then and you pay nothing, and any charge can be refunded within 14 days. How the free week works.
Questions
What does a scroll map show?
The share of visitors who reached each point down a page. The top of the page is always close to 100%, and the number falls as you go down. Most tools color the page from warm (most visitors saw this) to cool (few did) and let you hover to read the exact percentage at any point.
What is a good scroll depth?
There isn't a universal number. A short sign-up page and a long sales page should look very different. A better test: does a large share of visitors reach the main call to action and the proof that supports it? If they do, scroll depth isn't your problem, wherever the rest of the page ends.
Why does my scroll map show a sudden drop?
A sharp drop usually means one of two things: visitors found what they needed and acted or left, or something on the page looked like the end. Full-width images, big gaps, strong horizontal lines and large ads can all create a false bottom. Check the clicks just above the drop and watch a few recordings of visitors who left there.
How many visitors do I need for a scroll map?
Enough that one odd session doesn't move the line. Look at mobile and desktop separately, because the page is a different length on each, and treat a map built from a few dozen views as a hint to check, not a finding.