How to Analyze Session Recordings: Pick the Right 10, Take Notes That Add Up, and Turn Them Into Fixes
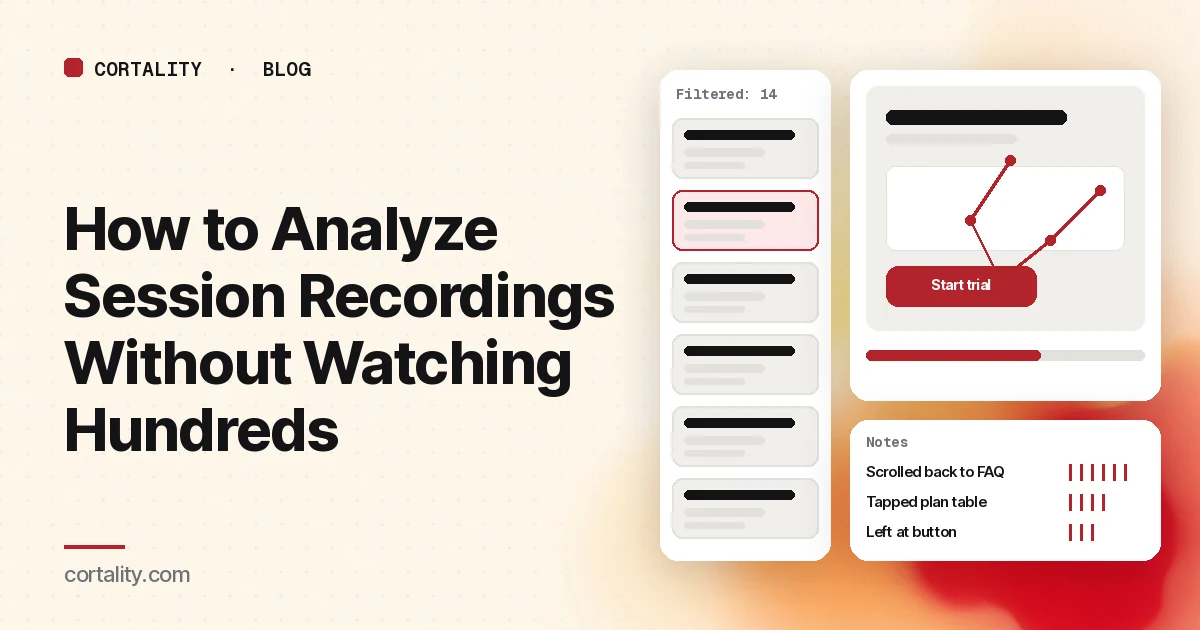
Session recordings are the most honest view of your website you can get: a visitor arrives, looks around, tries something, and either gets what they came for or leaves. The trouble is volume. A site with a few thousand visits a month has a few thousand recordings, most of them unremarkable, and nobody has time to watch them all.
The fix is to stop treating recordings as a feed to browse and start treating them as evidence for a question. This guide covers how to pick the handful worth watching, what to write down while you watch, how to tell a real pattern from one odd visitor, and how to turn what you see into fixes you can check.
What a session recording actually is
A session recording isn't a screen video. Microsoft Clarity, which is free and widely used, describes recordings as "step-by-step visual reconstructions" built by capturing the page's HTML and the visitor's actions: scrolls, clicks or taps, and page visits (Clarity). Two things follow from that:
- What you see is close to what they saw, but not identical. Fonts, third-party widgets and content that loads in an iframe can look different in the replay. If something looks broken in a recording, reproduce it on a real device before you assume it's broken for visitors.
- Sensitive content is hidden. Clarity masks sensitive content by default, and text typed into input boxes and drop-down menus is masked in all modes (Clarity). You'll see that someone filled in a field, not what they typed.
Recordings also don't last forever. Clarity keeps them for 30 days, and after that keeps only a sample (1% of recordings or 10 a day, whichever is higher) for up to 9 months, plus any you mark as favorites (Clarity). Favorite the useful ones as you go.
Step 1: Start with one question, about one page
Opening the recordings list with no question is how people lose an afternoon. Write down one question before you press play. Good questions name a page and an action:
- "Why do visitors who reach the pricing page leave without starting a trial?"
- "What do mobile visitors from our Meta ads do in the first 10 seconds on the landing page?"
- "Where do people get stuck in the demo request form?"
If you don't know which page to ask about, start with your funnel numbers, not recordings. Our guide to finding where visitors drop off covers how to find the step that leaks the most, and how to analyze user behavior on a website covers which tool answers which kind of question.
Step 2: Filter down to the sessions that answer it
Every recording tool has filters, and this is where most of the time savings come from. In Clarity you can filter recordings by page, device, browser, traffic source, medium and campaign, session duration, clicks, JavaScript errors, rage and dead clicks, and custom tags, and save a set of filters as a segment you can reuse (Clarity filters, segments).
Filters worth combining, depending on your question:
| Your question is about | Filter by |
|---|---|
| A specific page | Entry page or visited page = that URL |
| A paid campaign | Source, medium or campaign (your UTM tags) |
| Mobile problems | Device = mobile, watched separately from desktop |
| People who left | Exit page = the page you care about |
| Frustration | Rage clicks, dead clicks, or JavaScript errors |
| Real attempts, not bounces | Session duration over about 10 to 15 seconds, or clicks of at least 1 |
Then sort. Clarity's session list is ordered by most recent by default, and can also be sorted by duration, clicks and pages (Clarity). Sorting by clicks is a quick way to surface sessions where someone tried hard and still left.
One more filter that saves time: exclude your own team. Your colleagues testing the checkout look exactly like confused customers.
Step 3: Watch 10 to 20 sessions end to end, with a notes sheet
Watch each session from entry to exit, with inactivity skipped (Clarity has a skip inactivity option, per its recordings overview). Don't jump straight to the moment you're curious about, because what happened before often explains it.
Keep a simple sheet open while you watch, one row per observation:
| Session | Device | Page | Element | What happened | Ended how |
|---|---|---|---|---|---|
| #1 | Mobile | /pricing/ | Plan comparison table | Scrolled sideways twice, then pinched to zoom | Left |
| #2 | Mobile | /pricing/ | "Start trial" button | Reached it, paused, scrolled back up to the FAQ | Left |
| #3 | Desktop | /pricing/ | Annual/monthly toggle | Clicked it 4 times | Started trial |
Name the element, not the vibe. "Seemed confused" isn't something you can fix. "Scrolled back up to the shipping line twice before leaving" is.
What to look for, in rough order of how often it explains a lost conversion:
- The last thing they did before leaving. The exit moment is the single most useful frame in a recording.
- Hesitation near the main action. The cursor or scroll stops near the button, then they go somewhere else. Usually a missing answer: price, shipping, what happens next, whether it fits their case.
- Searching behavior. Scrolling up and down, opening menus, using site search. They're looking for something the page didn't put where they expected.
- Clicks that get no response. Clicking images, headings, or icons that aren't links. Our guide to rage clicks and dead clicks covers how to triage these.
- Form trouble. Returning to a field, deleting and retyping, an error that sends them back to the top. See form abandonment analysis.
- Never seeing it. The visitor leaves before scrolling to the section that would have answered their question. A scroll map shows how common that is across all visitors (see how to read a website heatmap).
Step 4: Count before you conclude
One recording is an anecdote. The point of the notes sheet is that you can count. After 10 to 20 sessions, group your rows by element and look at what repeats.
- Seen in several sessions, from different visitors, on the path to the main action: worth fixing.
- Seen once: note it, and look for it again next time you watch this page.
- Seen often but in sessions that convert anyway: friction, not a blocker. Lower priority.
Then check the size of the pattern with numbers. If recordings suggest mobile visitors miss the button below a long hero image, a scroll map or your analytics will tell you what share of mobile visitors never reach it. Recordings tell you why. Aggregate data tells you how many.
If nothing repeats, don't keep watching at random. Change the filter: a different device, a different traffic source, only sessions that reached the page and left from it.
Step 5: Turn each pattern into a fix you can check
For each pattern that survived the count, write one line in this form:
On [page], [how many of the sessions you watched] visitors [did what] at [element], so we'll [specific change], and we'll check [metric] over [time window].
For example: "On /pricing/, 6 of the 15 mobile sessions we watched scrolled back up to the FAQ from the trial button, so we'll move the two FAQ answers they opened (refunds and cancellation) next to the button, and we'll check trial starts from mobile pricing-page visits over the next three weeks."
Rank the lines by how close the element is to your main action and how often it showed up. Fix one or two at a time so you can tell what made the difference. Our guide to CRO without A/B testing covers how to compare before and after honestly when your traffic is too low for a split test.
Should you let AI summarize the recordings?
It can save time on the picking. Clarity's Session Insights uses generative AI to describe what happened in a session in plain language, (Clarity), and Clarity can also summarize the first 10 recordings in your filtered list or a set you pick (Clarity). Microsoft's own note on the feature says generative AI models "can sometimes misinterpret or generate incorrect information."
A sensible split: use summaries to decide which sessions to open, and watch the ones you'll base a change on. Don't put a summary sentence in front of your team as the evidence for a redesign.
The common mistakes
- Watching without a question. You'll remember the strangest session, not the most common problem.
- Mixing devices. Phone and desktop layouts fail in different places. Watch them as separate batches.
- Over-reading one visitor. Someone who clicked a heading 15 times is one person. Count across sessions.
- Watching only the people who left. Watch a few who converted too. If they hit the same friction and pushed through, it's real but not your biggest leak.
- Stopping at the observation. A notes sheet nobody turns into changes is just a diary.
Where Cortality fits
Recordings are great at showing why one visitor left. What they can't do is watch every visitor for you. Cortality does the counting: one tag measures how real visitors use every part of your page, element by element, including what they see, skip, tap and stop at. You get a ranked list of fixes, each with the evidence and the exact change to make, and after you ship a fix Cortality re-measures it and tells you whether it worked. It works alongside Google Analytics and Microsoft Clarity rather than replacing them, so you can keep using recordings to see the why behind a finding. See how it works or what a finding looks like.
For a quick first look, our free page leak scan takes about a minute and needs no install. It's a prediction from our attention model, not data from your real visitors, so use it to decide where to look first.
Plans are $99, $249 or $499 a month (Starter, Growth and Scale). Start your free week, and you see your first report before you pay. You save a card at signup, and nothing is charged until 3 days after your first report. Cancel before then and you pay nothing, and any charge can be refunded within 14 days. How the free week works.
Questions
How many session recordings should I watch?
Fewer than you think, if you filter first. Pick one page and one question, filter to the sessions that answer it, and watch 10 to 20 end to end. If the same problem shows up in several of them, you have something worth fixing. If nothing repeats, change the filter rather than watching more at random.
What should I look for in session recordings?
Look for moments where the visitor's intent and the page disagree: hesitation before the main button, scrolling up and down looking for something, repeated clicks on things that don't respond, form fields they return to or skip, and the last thing they did before leaving. Write each one down with the page, the element and the device.
Are session recordings real videos of my visitors?
No. Tools like Microsoft Clarity rebuild the session from the page's HTML and the visitor's recorded actions, such as scrolls, clicks and page visits. Clarity masks sensitive content by default, and input boxes and drop-down menus are masked in every mode.
Can AI summarize session recordings for me?
Some tools now do. Microsoft Clarity's Session Insights uses generative AI to describe what happened in a recording, and Microsoft notes these models can get things wrong. Summaries help you pick which sessions to watch; confirm a pattern in the recordings themselves before you change the page.