Signup Page Heatmap: Where Trial Signups Stall
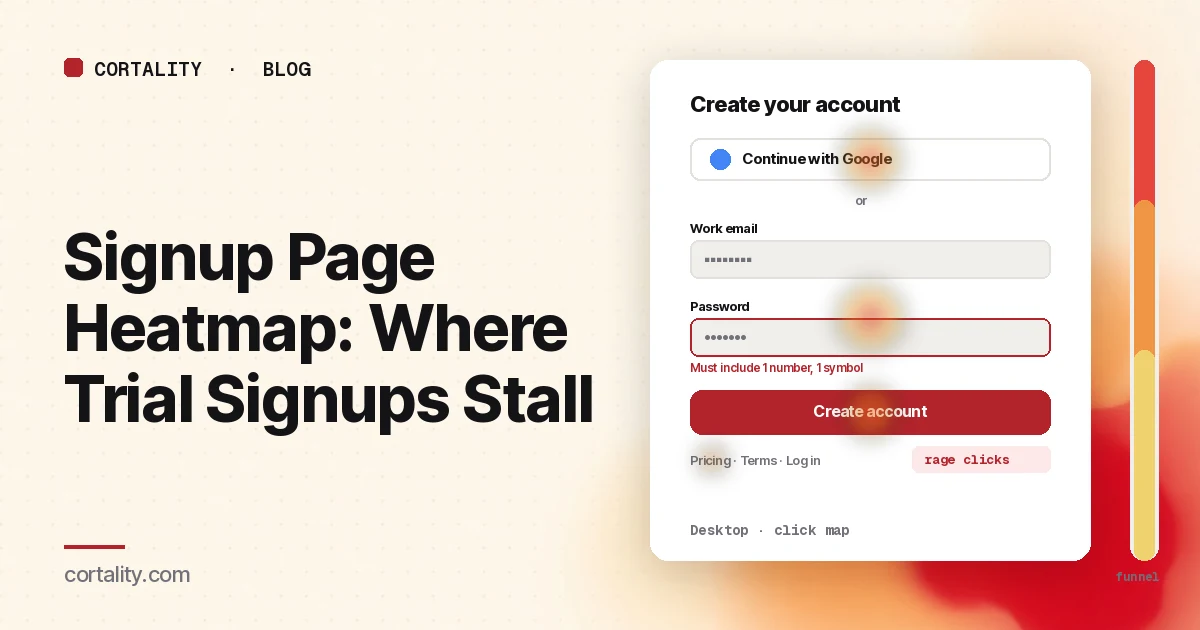
Someone has read your homepage, checked pricing and clicked "Start free trial." They land on the signup page, and many of them never create an account. Your analytics shows the page view and the missing signup. A signup page heatmap shows what happened on the one page between interest and a new account: whether they reached for the Google button or the email form, whether they fought the password field, and which link pulled them away.
This guide is about reading that data on the create-account page itself. If you're still deciding whether to send people to a separate page at all, read signup button or inline form first. For field-by-field numbers (which field people start, which one they abandon), use form abandonment analysis alongside this.
Set it up so the map means something
- Read the signup page on its own. If your signup page has variants (one per plan, or
?plan=parameters), decide whether to read them together or apart. Clarity can build a heatmap for an exact URL with its parameters or for every URL that starts with a path (Microsoft Clarity, Heatmaps overview). Start with all variants together, then split if one plan behaves differently. - Split by device. On a phone the sign-in buttons, form and side panel stack into one column, and the keyboard covers half the screen once a field is selected. Read desktop and mobile separately.
- Split by where visitors came from. Someone who clicked your pricing page button already chose a plan. Someone who came straight from an ad or a "Sign up" link in the header may not know what happens after they create an account. If one source is large, read it on its own.
- Know what the tool can't see. Microsoft Clarity masks the content of input boxes and drop-downs in all masking modes, and masked content is never uploaded (Microsoft Clarity, Masking content). Other tools have similar defaults. You'll see that people clicked the email field, not what they typed. That's what you want on a signup page.
- Know the page's states. Signup pages change as people use them: password rules appear on focus, error messages appear after submit, a second step loads in place, or a sign-in popup opens in a new window. The screenshot shows one state. Clarity notes that a page impression might not show the element a user clicked (Microsoft Clarity, Click maps). Write down which state you're looking at.
Read the click map as a ranked list
On a short page like this the colors are less useful than the ranking. Clarity ranks clicked elements by their share of clicks, including clicks on things that aren't links, and lets you switch to dead clicks, rage clicks, error clicks and last clicks (Microsoft Clarity, Click maps). Sort the top elements into four groups:
- Ways to sign up (a Google, Microsoft or other sign-in button, the email field, the submit button)
- Form fields (name, company, password, team size, and any checkboxes)
- Links that leave the page (log in, pricing, terms, privacy, the logo)
- Things that aren't links (plan summary, a testimonial, a feature list, a screenshot)
Sign-in buttons vs the email form
Compare clicks on each sign-in button with clicks on the email field. Neither number is good or bad on its own. What to look for:
- Clicks on a sign-in button with no matching signups from it. The click opened a popup or redirect, and some people stopped there, often at a permissions screen. Watch a few session recordings filtered to that click, then check the account creation numbers by method.
- Few clicks on the sign-in button, many on the email field, and a high exit rate. People may not have noticed the faster option, especially if it sits below the form on mobile. Check where it sits relative to the average fold on the scroll map.
The password field
Password rules are one of the most common sources of signup friction. Nielsen Norman Group recommends showing the rules while the field is selected, letting people unmask the password, and showing a strength meter, and notes that hidden rules force users to guess and retry (Nielsen Norman Group, Password Creation).
On a heatmap, look for:
- Many clicks on the password field per page view. Each new attempt after an error is another click into the field. Compare the password field's click count with the email field's. A much higher number usually means retries.
- Rage clicks or error clicks on the submit button. People pressed submit repeatedly, or a script error fired when they did. Test the form yourself on a phone with a password that breaks each rule.
- No clicks on a "show password" control, because there isn't one. On mobile, typos in a masked password field are easy to make and hard to spot. NN/g suggests showing the password by default on phones and offering a "Hide password" option.
Links that leave the page
The last-click map shows where people went when they left. On a signup page, these exits tell you what question was still open:
- Last clicks on "Pricing" or a plan summary. People wanted to check the cost or what happens when the trial ends. Answer it on the page in one line next to the button. Our pricing page heatmap guide covers the page they're going back to.
- Last clicks on "Terms" or "Privacy". Usually a question about billing, data use or cancellation. Put the short answer on the page and keep the link for the full text.
- Last clicks on the logo. People who wanted to go back and learn more. The signup page didn't remind them why they came.
- Last clicks on "Log in". Some are existing users who clicked "Sign up" by mistake. Some may be people who already started an account and got stuck. Check whether log in follows a failed signup in recordings.
Things that aren't links
Dead clicks on a plan name, a feature bullet or a screenshot beside the form mean people wanted more detail before committing. If one element collects many of them, either link it to the answer or add one line that answers it in place.
Fields: hand off to form analytics
A heatmap shows which fields get clicked. It doesn't show which field people left on, how long they spent on it, or which one triggered an error. For that, use form analytics, a funnel event per field, or form abandonment analysis. Two heatmap signals are still worth noting:
- A field nobody clicks. If "Company" or "Phone" gets far fewer clicks than the fields around it, and it's optional, people skip it. Consider asking for it later. Our guide to lead gen form fields covers which to keep.
- Clicks that fall off sharply at the last fields on mobile. If the final fields or the submit button sit below the open keyboard, people may not see that the form continues. Check the same drop in a few recordings before moving fields.
Common mistakes reading signup page heatmaps
- Expecting to see what people typed. Input content is masked, and it should be.
- Reading one state. Rules, errors and second steps change the page. Heat on an error message that isn't in the screenshot lands on whatever was there instead.
- Counting clicks on a sign-in button as signups. The click starts the flow. Account creation is a separate number.
- Ignoring existing users. People who clicked "Sign up" by mistake and then "Log in" inflate exits. Separate them in recordings before drawing conclusions.
- Stopping at account creation. A new account that never gets set up isn't a customer. Follow the first session after signup before you call the page fixed.
Turn one pattern into one change
Pick the single pattern that affects the most visitors closest to submit, and write it down as a hypothesis with a number you can re-check. For example (illustrative): "On mobile, the password field gets 2.4 clicks per page view against 1.1 for email, and the submit button has rage clicks. Show the password rules under the field while it's selected, show the password by default on phones, and compare signups per signup-page view over two equal weeks."
Our CRO hypothesis template gives you a format for writing these down. Signup pages rarely have enough traffic for a fast A/B test; CRO without A/B testing shows how to measure a before-and-after honestly.
Signup page heatmap checklist (copy this)
- Signup page variants read together, then split if one behaves differently
- Desktop and mobile read separately
- Traffic from pricing, header links and ads read separately if large
- A few hundred page views per device in the window, or a longer window with recordings
- Rule, error, second-step and popup states noted before reading heat
- Click ranking sorted into sign-up methods, fields, exits and non-links
- Sign-in button clicks compared with account creation by method
- Password field clicks per page view compared with email field clicks
- Rage and error clicks on submit tested on a real phone
- Last clicks on pricing, terms, logo and log in listed, and each question answered on the page
- Dead clicks on plan names, bullets and screenshots listed
- Field-level drop-off checked with form analytics
- One change shipped, re-measured over the same window length
Where Cortality fits
Most of this comes down to one question: what do visitors actually see, skip and click on your signup page, and where do they stop? Cortality measures how real visitors use every part of your page, including the sign-in buttons, the form and the links around it, on each device. You get a ranked list of fixes, each with the evidence and the exact change to make, and after you ship a fix Cortality re-measures it and tells you whether it worked. It works alongside Google Analytics and Microsoft Clarity rather than replacing them. For how it compares with GA4, Clarity, Hotjar and other tools marketers use, see our roundup of UX analytics tools for marketers. See how it works or what a finding looks like. For the rest of the path from homepage to signup, see Cortality for SaaS teams.
For a quick first look, our free page leak scan takes about a minute and needs no install. It's a prediction from our attention model, not data from your real visitors, so use it to decide where to look first.
Plans are $99, $249 or $499 a month (Starter, Growth and Scale). Start your free week, and you see your first report before you pay. You save a card at signup, and nothing is charged until 3 days after your first report. Cancel before then and you pay nothing, and any charge can be refunded within 14 days. How the free week works.
Questions
What does a signup page heatmap show?
Where visitors click and tap on the page where they create an account, how far they scroll, and which elements they click that aren't links. It shows whether people choose a sign-in button or the email form, which fields they click into, and which links take them away before they submit.
Can a heatmap see what people type into my signup form?
It shouldn't. Microsoft Clarity, for example, masks the content of input boxes and drop-downs in every masking mode. You see clicks on a field, not what was typed. That's the right default for a signup page, and it's why field-level questions are better answered with form analytics.
Why do visitors click the password field many times?
Usually because the password was rejected and they're trying again. Repeated clicks on the password field, or rage clicks on the submit button, often mean the rules weren't shown until after an error. Show the rules while the field is selected and let people see what they typed.
How much traffic do I need before reading a signup page heatmap?
Enough that each device has a few hundred page views in the date range you're reading. Signup pages get less traffic than the homepage, so use a longer window and lean on session recordings when the numbers are small.