Pricing Page Heatmap: What Clicks and Scroll Tell You Before Visitors Bounce
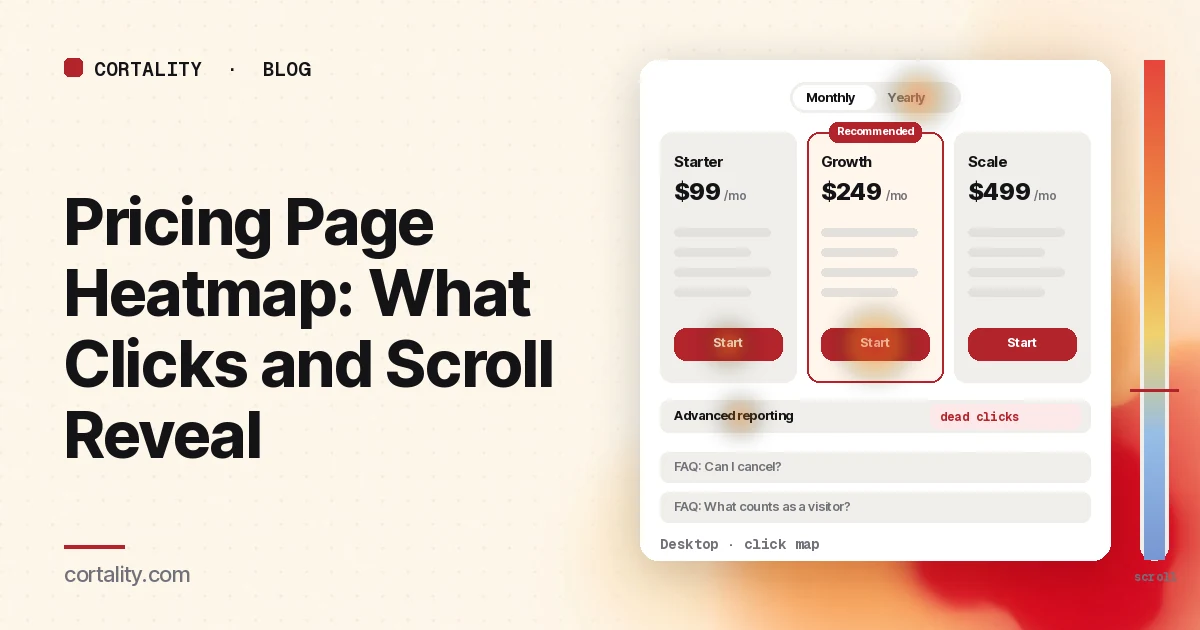
Visitors who reach your pricing page are close to a decision. When they leave without starting a trial or booking a call, your analytics shows an exit and not much else. A pricing page heatmap fills in the middle: which plan they looked at, whether they got to the comparison table, what they clicked trying to find an answer, and where they gave up.
This guide is about reading that data on your own page. If you want the design checklist first (show the price, name plans for the buyer, spell out billing terms), start with our SaaS pricing page best practices. Come back here when you want to know which of those checks your visitors are actually tripping over. To read the pricing page alongside your homepage, features and signup pages, see our guide to the SaaS heatmap.
Set it up so the map means something
Pricing pages get mixed traffic: new prospects comparing plans, existing customers checking their limits, people heading to Login, and the odd competitor. If you read all of it as one blob, the map describes nobody. Before you look at colors:
- Split by device. Desktop visitors see the plans side by side. Phone visitors usually see stacked cards and scroll through them one at a time, so the patterns are different. Clarity, for example, lets you switch between PC, tablet and mobile views on the same heatmap (Microsoft Clarity, Click maps). Our guide to mobile vs desktop heatmaps covers why they rarely match.
- Filter out customers if you can. Logged-in users, or visitors who arrive from your app, click "Login" and "Manage plan." They are not deciding whether to buy. Exclude them with a segment, or at least read new and returning visitors separately.
- Split by where they came from. Someone who arrives from your homepage already knows what you do. Someone who lands on pricing straight from a search ad or a comparison article may not. If pricing is a landing page for paid traffic, read that segment on its own.
- Use a fixed, long enough window. Pick a date range with a few hundred page views per device, and use the same length when you compare before and after a change. If your pricing page is quiet, our guide to heatmaps on a low-traffic website explains how to work with less data.
- Note the page's states. A monthly/yearly toggle, plan tabs on mobile or an expanding comparison table changes what's on screen. Heatmap screenshots usually capture one state, and Clarity notes that a page impression might not show the element a user clicked. Know which state you're looking at before you trust where the heat sits.
Read the scroll map first
The scroll map tells you what share of visitors even reached each part of the page. Clarity's scroll map shows the percentage of visitors at each point and the average fold, which is where the first screen ends for your visitors on that device (Microsoft Clarity, Scroll maps).
Write down where your key pieces sit, then read the percentage at each:
- The plan buttons. On desktop they're usually above the fold. On a phone, the button for the second or third plan can sit two or three screens down.
- The comparison table. This is where buyers check the one feature row they care about.
- Proof (a customer quote, logos, a security note).
- The FAQ, where people go looking for the catch.
Then look for these shapes:
- A sharp drop right after the plan cards. Visitors saw prices and left. Either the price surprised them, or they couldn't tell which plan was theirs. Check the click map for toggle use and clicks on plan descriptions before deciding which.
- A steady fade through a long comparison table. The table is too long to scan. Put a short "at a glance" version first and move the full table behind a link or expander.
- Very few visitors reach the FAQ, but your sales team hears the same five questions. The answers are on the page, just too low. Move the top two or three next to the buttons as one-line terms.
- On mobile, the recommended plan is the third card. If you badge the middle plan as recommended but stack cards in left-to-right order, many phone visitors never scroll far enough to see it.
Reaching a section isn't the same as reading it. Our scroll map guide covers how to tell a natural exit from a false bottom.
Then read the click map, element by element
On a pricing page the click map is most useful as a ranked list, not a color wash. Clarity ranks elements by their share of clicks, including clicks on things that aren't links, and on phones it records taps (Microsoft Clarity, Click maps). Go down the list and sort what you see into these groups.
Plan buttons, by column
Compare the share of clicks on each plan's button. Three things to look for:
- The recommended plan isn't the one people click. If your badge sits on Growth but most button clicks go to Starter, the badge isn't persuading anyone. Either the "for" line doesn't fit who's actually visiting, or the price gap looks too big for what the middle plan adds.
- Lots of clicks on the cheapest plan, few trials started. Check what happens after that click. A long signup form or a surprise in checkout loses people after the pricing page has done its job. Our signup page heatmap guide covers that next page.
- "Contact sales" outpulls self-serve. Fine if you sell to enterprises. If you don't, people may be asking a question the page should answer, often about limits or billing.
The billing toggle
Heavy clicks on a monthly/yearly toggle mean people are doing math. That's normal. It turns into a problem when recordings show visitors flipping back and forth and then leaving. Usually the saving isn't stated plainly ("2 months free" vs "Save 17%"), or the yearly price is shown per month and people can't tell what they'll actually be charged today. Show both the monthly-equivalent price and the amount billed.
Feature names and values that aren't links
Clicks on a feature row, a plan limit or an icon in the comparison table usually mean the visitor wants a definition. Clarity labels clicks that produce no response as dead clicks (Microsoft Clarity, Click maps). On a pricing page they're one of the clearest signals you'll get: they show you exactly which term is unclear. Add a tooltip or a one-line explanation, then check whether those clicks fall. Our guide to rage clicks and dead clicks covers how to separate confusion from a broken element.
FAQ expanders
If your FAQ uses accordions, the click share on each question is a ranked list of your buyers' objections. When "Can I cancel anytime?" or "What counts as a seat?" gets most of the opens, that answer belongs higher up, next to the buttons, not three screens down. For a standalone FAQ or help page, the FAQ page heatmap guide covers the same signals on a longer page.
Exits through the menu
Clicks on "Features", "Docs", "Customers" or "Blog" from the pricing page mean visitors went to find something the page didn't give them. Note which link takes the most clicks; it tells you what kind of reassurance is missing. On the menu itself, our website navigation heatmap guide goes deeper.
Use attention data to see which plans get considered
Clicks show what people did. Attention maps, where your tool has them, show where they spent time before deciding. On a pricing page that answers a question clicks can't: which columns get read at all.
Speero's eye-tracking study of one pricing page found participants spent the most time on the first two plans from the left, whatever those plans were. It was one product with people who weren't really buying, so treat it as a reason to check your own page, not as a rule. Our pricing page best practices post covers that study and its limits.
What to look for on your own map:
- Attention on the recommended column. If people spend most of their time on a different plan, ask why that plan looks like the safer pick.
- Time on the price line vs the feature list. Long dwell on the price and short time on the features often means the price is the question, not the features.
- Time on the billing terms line. A line like "billed yearly" or "cancel anytime" that gets read closely is doing real work. Keep it near the button.
Patterns, what they usually mean, and what to check
| What the heatmap shows | Likely meaning | Check next |
|---|---|---|
| Scroll drops right after the plan cards | Price surprise, or no clear "which plan is mine" | Toggle clicks, clicks on plan descriptions, recordings of exits |
| Most button clicks on a plan you don't recommend | Recommended plan's "for" line doesn't match visitors | Who these visitors are (source, company size); the price gap |
| Heavy toggle use, then exit | Yearly saving or amount billed is unclear | Recordings of toggle users; how the yearly price is written |
| Dead clicks on feature names or limits | Visitors need a definition | Which rows; add tooltips and re-measure those rows |
| One FAQ item gets most opens | A key objection sits too low | Move a one-line answer next to the buttons |
| High "Contact sales" share, small deals | A self-serve question is unanswered | What people ask in those calls or forms |
| Clicks on Docs or Features from pricing | Not enough reassurance on the page | Which link, and what page they read there |
These are starting hypotheses, not verdicts. A heatmap shows what happened; session recordings of five to ten visitors who showed the pattern usually tell you why.
Common mistakes when reading pricing page heatmaps
- Reading all traffic together. Existing customers clicking "Login" can be one of the hottest spots on the page and tell you nothing about buyers.
- Ignoring the toggle state. If the screenshot shows yearly prices but most visitors browsed monthly, heat on the price line is sitting on numbers they never saw.
- Treating a hot button as a win. A button can take lots of clicks and still lose people in signup. Follow the click into the next step.
- Changing three things at once. If you move the FAQ, rename plans and add a badge in one release, you won't know which one moved the numbers.
- Comparing uneven windows. A week that includes a launch email or a sale isn't comparable to a quiet week.
Turn one pattern into one change
Pick the single pattern that affects the most visitors closest to the button, and write it as a hypothesis with a number you can re-check. For example (illustrative): "On mobile, 31% of visitors reach the Growth card, which we mark as recommended. Move Growth to the first card on phones and compare Growth button taps and trial starts over two equal weeks."
Our CRO hypothesis template gives you a format for writing these down. If your pricing page doesn't get enough traffic for a proper A/B test, CRO without A/B testing shows how to measure a before-and-after honestly.
Pricing page heatmap checklist (copy this)
- Desktop and mobile read separately
- Existing customers excluded, or new and returning read apart
- Paid and search landings on pricing read as their own segment
- A few hundred page views per device in the window
- Toggle, tab and expander states noted before reading heat
- Scroll share recorded for plan buttons, comparison table, proof and FAQ
- Button clicks compared across plan columns
- Toggle use checked against exits in recordings
- Dead clicks on feature rows listed by row
- FAQ opens ranked; top objection moved near the buttons
- Menu exits from pricing noted by link
- One change shipped, re-measured over the same window length
Where Cortality fits
Most of this comes down to one question: what do visitors actually see, skip and click on your pricing page, and where do they stop? Cortality measures how real visitors use every part of your page, including which plan columns, table rows and FAQ items get attention, on each device. You get a ranked list of fixes, each with the evidence and the exact change to make, and after you ship a fix Cortality re-measures it and tells you whether it worked. It works alongside Google Analytics and Microsoft Clarity rather than replacing them. For how it compares with GA4, Clarity, Hotjar and other tools marketers use, see our roundup of UX analytics tools for marketers. See how it works or what a finding looks like. For the rest of the path from homepage to signup, see Cortality for SaaS teams.
For a quick first look, our free page leak scan takes about a minute and needs no install. It's a prediction from our attention model, not data from your real visitors, so use it to decide where to look first.
Plans are $99, $249 or $499 a month (Starter, Growth and Scale). Start your free week, and you see your first report before you pay. You save a card at signup, and nothing is charged until 3 days after your first report. Cancel before then and you pay nothing, and any charge can be refunded within 14 days. How the free week works.
Questions
What does a pricing page heatmap show?
Where visitors click and tap on the pricing page, how far down they scroll, and, in tools with attention maps, where they spend time. Read together, they show which plans people consider, whether they reach the comparison table and FAQ, and which elements they click looking for answers.
Why do visitors click plan feature names that aren't links?
Usually because they want a definition. Repeated clicks on a feature row or a value like "Advanced reporting" mean the label doesn't explain itself. Add a short tooltip or a one-line definition and check whether those dead clicks drop.
How much traffic do I need before reading a pricing page heatmap?
Enough that each device has a few hundred page views in the date range you're reading. Below that, one or two busy sessions can swing the percentages. If your pricing page gets less, read it over a longer window and lean on session recordings.
Is a pricing page heatmap different from pricing page best practices?
Yes. Best practices tell you what a good pricing page usually includes. A heatmap tells you what your own visitors actually do on yours, so you can see which of those practices is missing or failing.