Features Page Heatmap: What SaaS Buyers Actually Read Before They Sign Up
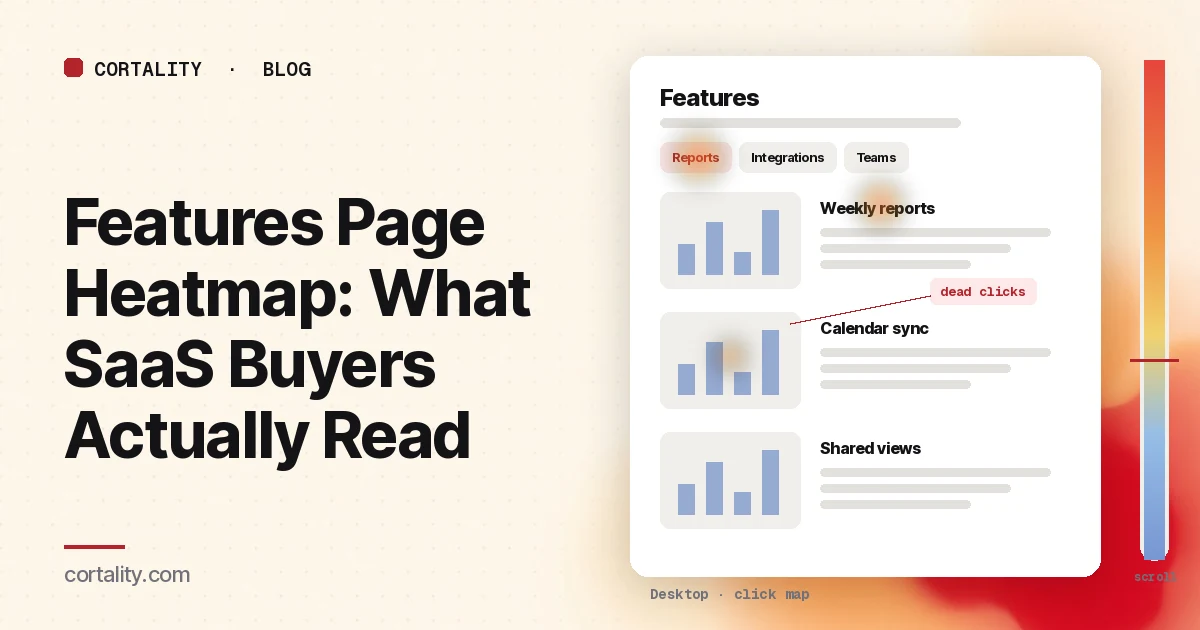
Visitors who open a SaaS features page have usually decided the product might fit. Now they're checking: does it do the one or two jobs they care about, and how well? Most features pages answer with a long list of equal-looking blocks, and buyers skim it for the parts they came for. A features page heatmap shows which parts those were, which blocks nobody reached, and whether anyone clicked through to pricing or signup afterwards.
This guide is about reading that data on a SaaS features page (or product tour page). If you're working on the homepage, our SaaS homepage best practices go through it section by section. For the page buyers usually open next, see the pricing page heatmap guide. To read the features page alongside your homepage, pricing and signup pages, see our guide to the SaaS heatmap. If you're new to heatmaps, how to read a website heatmap covers the basics.
Why features pages leak
A features page has a harder job than it looks. Buyers arrive with a specific question, and the page answers every question at once. The usual reasons it loses them:
- Every feature gets the same weight. Twelve blocks with the same icon, heading size and paragraph length give buyers no clue where to look.
- Headings use internal names. "Smart Sync" means something to your team. A buyer scanning for "works with Google Calendar" may skip right past it.
- The good part is hidden. Tabs, accordions and carousels keep the page short but hide content until someone clicks.
- There's no next step after the list. The button is at the top, buyers scroll through features, and when they're ready to act the only option is to scroll back up or open the menu.
A heatmap won't tell you which of these is true on its own, but each one leaves a pattern you can check.
Decide what a good visit looks like
Before you read the map, decide what a features page visit should lead to. For most SaaS sites it's one of three next steps: the pricing page, the signup page, or a demo request. Check that each is tracked in your analytics, and note the share of features page visitors who take one of them in a fixed window. That's the number a change should move. Clicks on the page itself only matter if they lead there.
Set it up so the map means something
- Split by device. Feature grids stack into one long column on a phone, side-by-side screenshots shrink, and tabs often become a dropdown. Read desktop and mobile separately; our guide to mobile vs desktop heatmaps explains why.
- Split by where visitors came from. Someone who clicked "Features" in your menu is evaluating. Someone who landed from an ad for one feature wants that feature. Someone who came from your docs or app may already be a customer. If one source is large, read it on its own.
- Group feature pages that share a template. If you have one page per feature, group them to judge the layout, and read the busiest one on its own. Clarity lets you add several URL filters to view one heatmap for a group of pages (Microsoft Clarity, Click maps).
- Know the page's states. Tabs, accordions and carousels show different content in the same spot. Clarity notes that a page impression might not show the element a user clicked (Microsoft Clarity, Click maps). Write down which tab is open in your screenshot before you read the heat.
- Use a long enough, fixed window. Aim for a few hundred page views per device, and keep the window the same length when you compare before and after a change. If your traffic is small, heatmaps on a low-traffic website covers what you can still read.
How buyers scan a features page
Most visitors scan rather than read. Nielsen Norman Group's eyetracking research describes several scanning patterns. In the F-shaped pattern, people read across the first lines, then less and less, mostly down the left side, so the first lines get more attention than later ones and the first words of each line more than the last. In the layer-cake pattern, people read headings and subheadings and skip the text below. In the spotted pattern, they skip chunks of text looking for something specific, such as a word or a number (NN/g, F-Shaped Pattern of Reading).
On a features page, that has two practical effects:
- Headings do most of the work. If buyers read only the headings, they should still learn what the product does. NN/g advises starting headings with the words that carry the most information (NN/g, F-Shaped Pattern of Reading). "Sync with Google Calendar" works better than "Smart Sync" for a buyer scanning down the page.
- Order matters. Attention falls as the page goes on. In NN/g's 2018 eyetracking study, people spent about 57% of their page-viewing time above the fold, 74% in the first two screenfuls, and 81% in the first three (NN/g, Scrolling and Attention). The feature that wins most deals shouldn't be ninth on the list.
Clarity's attention maps, which show how long visitors spend on each part of the page, are a useful check here (Microsoft Clarity, Heatmaps overview). Long time on a heading and little on the paragraph below it can be a sign of the layer-cake pattern.
Read the scroll map first
On a features page, the scroll map tells you which blocks buyers ever see. Open it and note the share of visitors who reach each feature block, especially the one your sales team says wins most deals. Clarity shows the share of visitors at each 5% of page height, the drop-off at each point, and the average fold (Microsoft Clarity, Scroll maps).
Two things to check:
- Sharp drops right after a block. A sudden drop just after a section, rather than a slow decline, usually means something there made people stop: a big full-width image that looks like the end of the page, a block that answered their question, or a block that lost them. NN/g calls the first case the illusion of completeness and recommends cues such as cut-off content to show there's more below (NN/g, Scrolling and Attention).
- Where the next step sits. Note where your main button and any lower buttons sit against the scroll curve. A button after the last block may be seen by only a small share of visitors.
If you use Google Analytics, its built-in scroll event only fires when a visitor reaches 90% of the page height (Google Analytics, Enhanced measurement events), so it tells you who reached the end, not where the rest stopped. Use the scroll map for that. Our guide to scroll map analysis covers more.
6 features page heatmap patterns, and what each usually means
The examples below are illustrative, to show what each pattern looks like. Your numbers will differ.
1. Heat on the first tab, almost none on the others
Buyers see the first tab's content and rarely open the rest. If the features inside later tabs matter for buying, they're effectively hidden. Count clicks on each tab label. If later tabs get few opens, either put the most-asked-for feature in the first tab or lay the content out as plain sections with clear headings.
2. Accordions opened in a clear order of interest
Clicks on accordion labels are a free survey: buyers are telling you which features they wanted to know more about. Rank the labels by clicks. The top two or three deserve an open, visible section near the top of the page, and your homepage may need to mention them too.
3. Dead clicks on screenshots, icons or feature names
Buyers tap a screenshot expecting it to zoom, or a feature heading expecting a detail page. Clarity marks clicks with no response as dead clicks (Microsoft Clarity, Click maps). Make the element do what buyers expect (open a larger image, link to the feature's page or docs), or style it so it doesn't look clickable. Our guide to rage clicks and dead clicks covers how to tell them apart.
4. Buyers leave through the menu to pricing
Clicks on "Pricing" in the menu from a features page are usually a good sign: buyers want to know what it costs. But if that's the most clicked element on the page and your page has no pricing link of its own, buyers are working around the page. Add a short "See plans" link or a one-line price note after the feature blocks. Then check the pricing page heatmap to see what happens next.
5. Heavy heat on one block's heading, little on its text
Buyers find the feature, then skip the explanation. The paragraph may be too long, too vague, or about how the feature works rather than what it does for them. Cut it to one or two lines that say what changes for the buyer, and add a screenshot that shows it.
6. Many reach the bottom, few click the button there
Buyers scrolled all the way, so they were interested, but the last button didn't match where they were. A "Start free trial" button may be too big a step for someone who wanted to see plans or ask a question. Check what the last clicks on the page are. If many go to pricing or the docs, offer that link next to the button.
Put the next step where buyers decide
Most features pages put the main button at the top and maybe one at the very bottom. The scroll map usually shows that many visitors never reach the bottom. A better pattern:
- Keep the main button near the top for visitors who arrived knowing what they want.
- Add one after the block where the scroll curve drops most, so visitors who've seen enough get a next step before they leave.
- Make the lower button match the moment. After the features, "See plans" or "Start free trial" usually fits better than a vague "Learn more."
Our guide to CTA button placement covers how to test placement without guessing.
Common mistakes reading features page heatmaps
- Reading clicks on a closed tab's content. If the screenshot shows tab one, heat that belongs to tab three lands on tab one's content.
- Treating few clicks on a block as "ignored". Most feature blocks aren't clickable. Check scroll reach and attention time before deciding nobody cared.
- Mixing evaluators and customers. Existing users who come from the app or docs read the page differently from new buyers. Split them if you can.
- Judging the page by clicks alone. A features page is a middle step. Judge changes by the share of visitors who go on to pricing, signup or a demo.
- Reordering everything at once. Move one block or change one tab, then re-measure, or you won't know what helped.
Turn one pattern into one change
Pick the single pattern that affects the most buyers near the top of the page, and write it down as a hypothesis with a number you can re-check. For example (illustrative): "On desktop, the 'Integrations' tab is opened more than any other, but it's the fourth tab. Make integrations the first visible section, and compare the share of features page visitors who go on to pricing or signup over two equal weeks."
Our CRO hypothesis template gives you a format for writing these down. Features pages rarely get enough traffic for a fast A/B test; CRO without A/B testing shows how to measure a before-and-after honestly. For the rest of the path from first page to signup, our SaaS website conversion audit covers each step, and our guide to elements visitors ignore explains why some sections get skipped.
Features page heatmap checklist (copy this)
- Next steps (pricing, signup, demo) tracked, with a baseline share of visitors who take one
- Desktop and mobile read separately
- Menu visitors, ad visitors and existing customers read separately where possible
- A few hundred page views per device in the window
- Open tab and accordion state noted before reading heat
- Share of visitors reaching each feature block noted from the scroll map
- Sharp drops after a block checked for false bottoms
- Clicks counted on each tab and accordion label
- Dead clicks on screenshots, icons and headings listed
- Last clicks checked, including menu clicks to pricing
- Buttons checked against the scroll curve
- One change shipped, re-measured over the same window length
Where Cortality fits
Most of this comes down to one question: what do buyers actually see, skip and click on your features page, and where do they stop? Cortality measures how real visitors use every part of your page, including each feature block, tab and button, on each device. You get a ranked list of fixes, each with the evidence and the exact change to make, and after you ship a fix Cortality re-measures it and tells you whether it worked. It works alongside Google Analytics and Microsoft Clarity rather than replacing them. See how it works or what a finding looks like. For the rest of the path from homepage to signup, see Cortality for SaaS teams.
For a quick first look, our free page leak scan takes about a minute and needs no install. It's a prediction from our attention model, not data from your real visitors, so use it to decide where to look first.
Plans are $99, $249 or $499 a month (Starter, Growth and Scale). Start your free week, and you see your first report before you pay. You save a card at signup, and nothing is charged until 3 days after your first report. Cancel before then and you pay nothing, and any charge can be refunded within 14 days. How the free week works.
Questions
What does a features page heatmap show?
Where visitors click on your features page, including tabs, accordions, screenshots and things that aren't links, and how far down the page they scroll. Read together, the two maps show which feature blocks buyers reach, which ones they open or click, and where most of them stop.
Do tabs and accordions break features page heatmaps?
They make them harder to read. Content inside a closed tab or accordion isn't in the screenshot, so clicks on it land on whatever the screenshot shows instead. Count clicks on each tab or accordion label to see which ones buyers open, and pick a screenshot with the state you want to read.
Where should the CTA go on a features page?
Where buyers decide, which a scroll map helps you find. Keep the main button near the top for visitors who already know what they want, and add one after the block where most visitors stop scrolling, not only at the very bottom where few of them arrive.
How much traffic does a features page heatmap need?
A few hundred page views per device in the window you're reading is a sensible minimum. Features pages often get less traffic than the homepage or pricing page, so you may need a longer window, and a few session recordings help confirm what the map suggests.