Product Page Heatmap: Where Shoppers Look Before Add to Cart
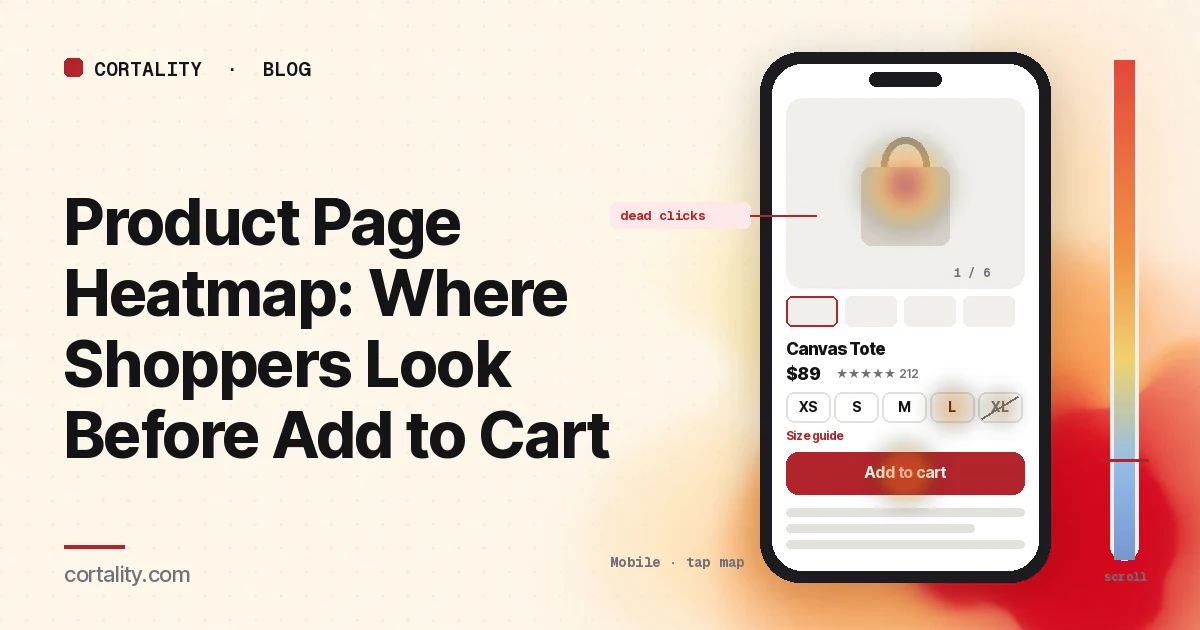
Shoppers land on your product page, look at a few photos, maybe tap a size, and leave. Your analytics records a view and no add to cart. A product page heatmap shows what happened in between: which photos they swiped through, whether they found the size guide, whether the add to cart button was even on their screen, and what they tapped looking for an answer the page didn't give them.
This guide is about reading that data. It works for any store platform. If you want a straight checklist of what a good product page includes, start with our 12-point Shopify product page audit, which applies to most stores. If shoppers do add to cart but don't buy, the problem is later in the funnel, and our guide to add to carts with no sales shows how to find the step where they leave.
Set it up so the map means something
A heatmap is an average of many visits. If the visits you average don't belong together, the map describes nobody. Before you look at colors:
- Decide: the template, or one product. Most stores use one product template for the whole catalog. Reading all product pages together answers layout questions (is the button reachable, do people find the shipping line). Microsoft Clarity, for example, can build a heatmap for a group of pages using path filters, so a filter on
/products/covers every product page (Microsoft Clarity, Heatmaps overview). Your best seller, read on its own, answers product questions (which photo do people stop on, which size do they pick, what do they ask). Do both, and don't mix the conclusions. - Split by device. On desktop the gallery and the buy box usually sit side by side. On a phone they stack: photos first, then name, price, options and the button, often below the first screen. The two maps rarely look alike. Our guide to mobile vs desktop heatmaps explains why.
- Split by where shoppers came from. Someone who arrives from a collection page has already compared products. Someone who lands straight from a social ad sees your product page as the first page of your store. If ads send traffic directly to product pages, read that segment on its own. To see what shoppers did on the step before, read our collection page heatmap guide.
- Use a long enough, fixed window. Aim for a few hundred page views per device, and keep the window the same length when you compare before and after a change. Avoid windows that include a sale, unless the sale is what you're studying. If one product page is quiet, our guide to heatmaps on a low-traffic website covers how to work with less data.
- Know the page's states. Product pages change while people use them: the photo changes when a color is picked, tabs and accordions open, a sticky add to cart bar appears after scrolling, a popup covers the first screen. Heatmap screenshots usually capture one state, and Clarity notes that a page impression might not show the element a user clicked (Microsoft Clarity, Click maps). Note which state you're looking at before you trust where the heat sits.
Read the scroll map first
The scroll map tells you what share of shoppers even reached each part of the page. Clarity's scroll map shows the percentage of visitors at each point and the average fold, which is roughly where the first screen ends for your visitors on that device (Microsoft Clarity, Scroll maps).
Write down where the parts that matter sit, then read the percentage at each:
- The add to cart button (and, on a phone, where the sticky bar appears, if you have one)
- The variant picker (size, color, quantity)
- The shipping and returns line
- The description, or the first tab or accordion
- Reviews
Then look for these shapes:
- On mobile, the add to cart button sits below the average fold. Every shopper has to scroll past the gallery to reach it. That's common and not automatically bad, since many shoppers will look at photos first anyway. It becomes a problem when the scroll map shows a big share leaving inside the gallery, before they ever reach the price or the button.
- Most shoppers reach the button, but few reach the reviews. If your star rating near the title links down to the reviews, check the click map for taps on it before deciding. Shoppers who jump straight to reviews don't scroll through the description, so the scroll map alone can understate how many people read them.
- A steady fade through a long description. Shoppers are skimming. Baymard Institute observed many users skipping or skimming product descriptions in testing, even when the description held the answer to their question (Baymard Institute, Product image descriptive text). Put the three or four facts people actually ask about in a short list near the button, and keep the long copy below.
- A drop right after a full-width banner or a "you may also like" row. Shoppers either think the page has ended or they take the exit you offered. Check whether reviews or shipping details sit below that point.
Reaching a section isn't the same as reading it. Our scroll map guide covers how to tell a natural exit from a false bottom.
Then read the click map, element by element
On a product page the click map is most useful as a ranked list, not a color wash. Clarity ranks elements by their share of clicks, including clicks on things that aren't links, and records taps on phones and tablets (Microsoft Clarity, Click maps). Go down the list and sort what you see into these groups.
The photo gallery
Expect the gallery to be one of the hottest areas on the page. In Baymard Institute's product page testing, 56% of users began by exploring the product images when they arrived, before reading the title or description (Baymard Institute, In-scale product images). So heat on photos isn't a finding by itself. What to look for:
- Dead clicks on the main photo. If taps on the main image produce no zoom or full-screen view, shoppers are trying to look closer and can't. Clarity labels clicks that produce no response as dead clicks. Make the image open or zoom, and re-check those clicks.
- Clicks that stop at one thumbnail. If most gallery clicks go to the first two or three thumbnails, the photos further along are rarely seen. If one of those is the photo that shows scale, fit or what's in the box, move it earlier.
- Heavy swiping, then exit. Watch a few session recordings of shoppers who did this. Often they're looking for a specific view (the back, the label, the product in use) that isn't there.
The variant picker
Clicks on size, color and other options show what shoppers want to buy. The useful signals are around the edges:
- Taps on sold-out or unavailable options. If shoppers keep picking an option that turns out to be unavailable, mark it more clearly before they tap, or offer a back-in-stock alert there.
- Clicks on the size guide link. A heavily used size guide is a sign it's needed. If recordings show people opening it and then leaving, the guide isn't answering the question. Check that it uses the measurements shoppers have, not only your internal size codes.
- Repeated switching between two options. Shoppers flipping between two sizes or colors are unsure. Fit notes ("runs small, size up") or a photo of each color in natural light usually help more than another paragraph of copy.
The add to cart button
Compare the add to cart button's share of clicks with everything else around it. Three things to look for:
- Rage clicks on the button. Several fast clicks in the same place usually mean the button didn't visibly respond: the cart drawer opened slowly, no message appeared, or an error went unnoticed. Our guide to rage clicks and dead clicks covers how to separate a slow button from a broken one.
- Clicks on the button before an option is picked. If many shoppers tap add to cart and get a "please select a size" message, the picker isn't prominent enough, or the default looks selected when it isn't.
- Express checkout buttons taking most of the clicks. If your store shows express checkout buttons on the product page, those shoppers may skip the cart entirely. That's fine, but count them when you compare add to cart rates before and after a change.
Text, icons and badges that aren't links
Clicks on a material name, a "free shipping" badge, a delivery estimate or a feature icon usually mean the shopper wants more detail. They're one of the clearest signals on the page, because they name exactly what's unclear. Either make the element open a short explanation, or put the answer next to it.
Tabs, accordions and the star rating
If your description, shipping and returns, and care details sit in tabs or accordions, the share of opens on each is a ranked list of shoppers' questions. When "Shipping & returns" gets more opens than "Description", the answer belongs under the button as one plain line. Taps on the star rating near the title tell you how many shoppers want reviews before anything else.
Use attention and conversion data, where your tool has them
Clicks show what shoppers did. Attention maps show where they spent time: Clarity's attention map reports the average time spent on each part of the page (Microsoft Clarity, Attention maps). On a product page that answers questions clicks can't: whether shoppers actually stop on the price, the shipping line or the fit notes, or scroll straight past them.
Some tools also tie clicks to purchases. Clarity's conversion maps, available on projects where it detects purchase events, show the share of sessions that ended in a purchase when a shopper clicked in a given area (Microsoft Clarity, Conversion maps). That's useful for one question in particular: which interactions, like opening the size guide or reading reviews, go along with buying. Treat it as correlation, not cause. Shoppers who open the size guide may simply be more serious to begin with.
Patterns, what they usually mean, and what to check
| What the heatmap shows | Likely meaning | Check next |
|---|---|---|
| Big drop inside the gallery on mobile | Shoppers leave before seeing price or button | How many photos come before the buy box; whether price shows near the first photo |
| Dead clicks on the main photo | Shoppers want to zoom and can't | Whether tap-to-zoom or full-screen works on phones |
| Few clicks past the third thumbnail | Later photos are rarely seen | Which photo answers the main question; move it earlier |
| Taps on sold-out options | Unavailable options aren't obvious | How sold-out options are marked before the tap |
| Heavy size guide use, then exit | The guide doesn't answer the fit question | Recordings of size guide users; the guide's measurements |
| Rage clicks on add to cart | The button doesn't visibly respond | What happens after the tap on a real phone |
| Clicks on badges or delivery text | Shoppers want details | Which element; add a short explanation next to it |
| "Shipping & returns" tab opened most | Cost or returns is the main worry | A one-line shipping and returns note under the button |
These are starting hypotheses, not verdicts. A heatmap shows what happened; recordings of five to ten shoppers who showed the pattern usually tell you why.
Common mistakes when reading product page heatmaps
- Reading one product with too little traffic. A few dozen views can produce confident-looking colors. Read the template as a group first.
- Ignoring the variant state. If the screenshot shows one color but most shoppers picked another, heat on the gallery sits on photos many of them never saw.
- Missing the sticky bar. A sticky add to cart bar is usually a separate element from the main button, and the screenshot shows it in only one position. Add the two together before you judge how many shoppers tapped add to cart.
- Treating gallery heat as a problem. Shoppers are supposed to look at photos. The question is whether they get the view they need and then move on to the buy box.
- Stopping at add to cart. A healthy click share on the button doesn't mean shoppers buy. Follow them into the cart and checkout with the funnel steps before you call the page fixed.
Turn one pattern into one change
Pick the single pattern that affects the most shoppers closest to the button, and write it down as a hypothesis with a number you can re-check. For example (illustrative): "On mobile, 41% of product page visitors leave inside the gallery, and most never reach the price. Add the price and star rating directly under the first photo, then compare the share who reach add to cart and the add to cart rate over two equal weeks."
Our CRO hypothesis template gives you a format for writing these down. Most stores don't have enough traffic on one product page for a proper A/B test; CRO without A/B testing shows how to measure a before-and-after honestly. Preparing for a big sale? Do the sale-specific checks in our Black Friday product page checklist after this.
Product page heatmap checklist (copy this)
- Product template read as a group, and the best seller read on its own
- Desktop and mobile read separately
- Ad traffic that lands directly on product pages read as its own segment
- A few hundred page views per device in the window, with no sale inside it
- Variant, tab, sticky bar and popup states noted before reading heat
- Scroll share recorded for the button, variant picker, shipping line, description and reviews
- Dead clicks on photos checked; tap-to-zoom works on phones
- Thumbnail clicks reviewed; the most useful photo moved early
- Taps on sold-out options and size guide use checked against exits
- Rage clicks on add to cart checked on a real phone
- Clicks on badges, icons and delivery text listed by element
- Tab and accordion opens ranked; top question answered under the button
- One change shipped, re-measured over the same window length
Where Cortality fits
Most of this comes down to one question: what do shoppers actually see, skip and tap on your product page before they add to cart or leave? Cortality measures how real visitors use every part of your page, including the gallery, the variant picker, the button and the details below it, on each device. You get a ranked list of fixes, each with the evidence and the exact change to make, and after you ship a fix Cortality re-measures it and tells you whether it worked. It works alongside Google Analytics and Microsoft Clarity rather than replacing them. For how it compares with GA4, Clarity, Hotjar and other tools marketers use, see our roundup of UX analytics tools for marketers. See how it works or what a finding looks like. For stores, see Cortality for Shopify stores.
For a quick first look, our free page leak scan takes about a minute and needs no install. It's a prediction from our attention model, not data from your real visitors, so use it to decide where to look first.
Plans are $99, $249 or $499 a month (Starter, Growth and Scale). Start your free week, and you see your first report before you pay. You save a card at signup, and nothing is charged until 3 days after your first report. Cancel before then and you pay nothing, and any charge can be refunded within 14 days. How the free week works.
Questions
What does a product page heatmap show?
Where shoppers click and tap on your product pages, how far down they scroll, and, in tools with attention maps, where they spend time. Read together, they show whether shoppers reach the add to cart button, which photos and options they interact with, and which elements they click looking for answers before they buy or leave.
Should I read one product page or all of them together?
Both, for different questions. Most stores use one template for every product, so reading all product pages as a group shows layout problems that affect the whole catalog. Your best-selling product, read on its own, shows problems specific to that product, like a confusing size range or missing photos.
Why do shoppers click the main product photo so much?
Because photos are how most people evaluate a product online. In Baymard Institute's usability testing, 56% of users started by exploring the product images when they arrived on a product page. Heavy photo clicks are normal. They become a problem when the clicks are dead clicks, meaning the photo doesn't zoom or open when tapped.
How much traffic do I need before reading a product page heatmap?
Enough that each device has a few hundred page views in the date range you're reading. A single product rarely gets that quickly on a small store, so read your product pages as a group, or use a longer window and lean on session recordings.