Collection Page Heatmap: What Shoppers Click Before a Product
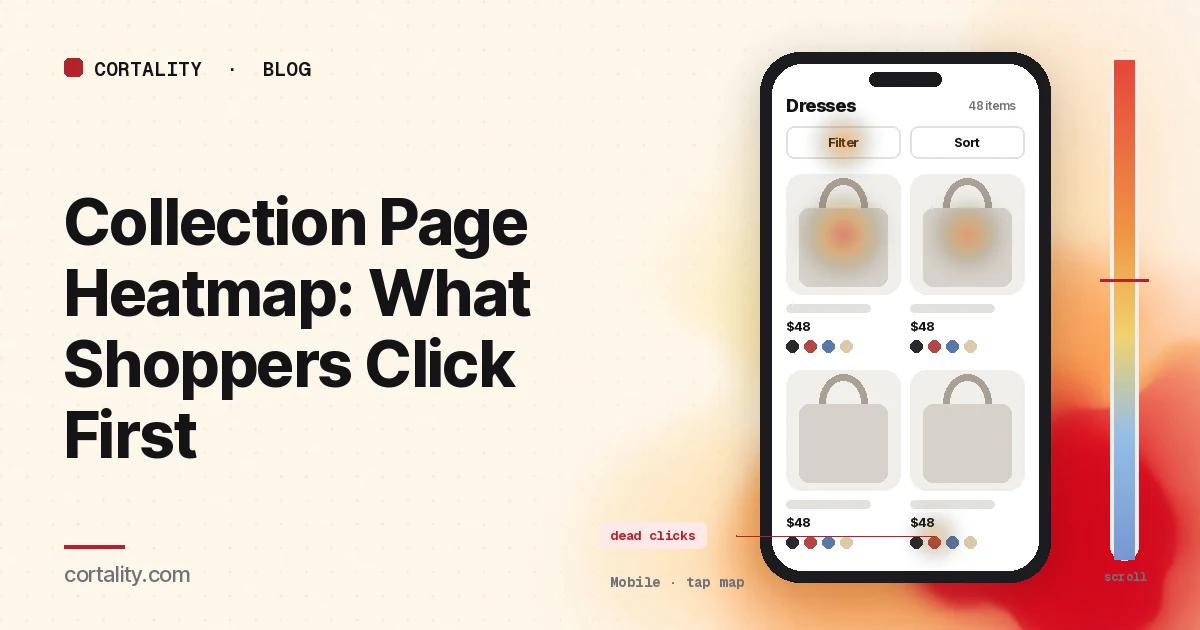
Shoppers who land on a collection page haven't picked a product yet. They're deciding whether you have what they want, and which item to open first. When the page works, they tap a product. When it doesn't, they scroll, filter, tap things that don't respond, and leave. A collection page heatmap shows which of those happened, on the page where most of your product page views begin.
This guide is about reading that data on category and collection pages (product listing pages, in ecommerce terms). If you want the settings to check first, sort order, filters, product cards and empty results, start with the Shopify collection page optimization checklist. For the next page in the journey, see our product page heatmap guide. If you're new to heatmaps, how to read a website heatmap covers the basics.
Product lists are worth the effort. Baymard Institute's product list benchmark of 170+ large ecommerce sites rated 58% of desktop sites and 78% of mobile sites "mediocre" or worse for product list UX (Baymard Institute, Product list and filtering). Those are big stores with UX teams, so a theme default on a small store is worth checking with real data.
Set it up so the map means something
- Decide: template or collection. The filter button, sort menu and product card design are the same on every collection, so group all collection pages to judge them. Microsoft Clarity lets you add several URL filters to view heatmaps for a group of pages (Microsoft Clarity, Scroll maps). The products, their order and the banner differ by collection, so read your busiest collection, or the one your ads point to, on its own.
- Start with the unfiltered view. When shoppers filter or sort, the same grid positions show different products. Filtered and sorted views usually add parameters to the URL, so you can include or exclude them. Read the default view first, then the filtered views as a separate group.
- Split by device. A four-column desktop grid becomes two columns on a phone, and the filter sidebar becomes a button. Read each device separately. Our guide to mobile vs desktop heatmaps explains why the maps differ.
- Split by where shoppers came from. Someone arriving from your homepage menu is browsing. Someone landing from a "new arrivals" ad is looking for what the ad showed. If ads send a lot of traffic straight to a collection, read that segment on its own.
- Know how the page loads more products. With pagination, each page is its own map. With infinite scroll or a "Load more" button, the page grows as people scroll, so 50% scrolled means a different spot for different visitors. Note which one you have before reading the scroll map.
- Know the page's states. Filter drawers, quick view popups and "added to cart" messages cover the grid while they're open. Clarity notes that a page impression might not show the element a user clicked (Microsoft Clarity, Click maps). Write down which state your screenshot shows.
Read the click map as a ranked list
Clarity ranks clicked elements by share of clicks, including things that aren't links, and lets you switch to dead clicks, rage clicks and last clicks. Sort the top elements into four groups:
- Products (card images, titles, prices, and any quick add or quick view buttons)
- Ways to narrow the list (the filter button or sidebar, filter values, applied filter chips, the sort menu, search)
- Ways to leave (the main menu, the logo, breadcrumbs, other collections)
- Things that aren't links (swatches that don't change anything, ratings, badges, the banner, the collection description)
Then open the scroll map and note the share of visitors who reach the second row, the fourth row and the bottom of the first batch of products (Microsoft Clarity, Scroll maps).
7 collection page heatmap patterns, and what each usually means
The examples below are illustrative, to show what each pattern looks like. Your numbers will differ.
1. Almost all product clicks land on the first row
Position matters on every list, so some of this is normal. The question is whether the first row holds the products shoppers want or just the ones that happened to be added first. Check what the collection is sorted by. Baymard found shoppers commonly look for four sort options, price, user rating, best selling and newest (Baymard Institute, Product list and filtering). Pick a default sort on purpose, then compare product views per collection visit before and after.
2. Heavy clicks on the banner or description, few on products
On a phone, a tall banner and an intro paragraph can push the first products below the average fold. Shoppers tap the banner expecting it to lead somewhere, or leave before the grid starts. Check where the first product card sits against the average fold on the mobile scroll map. Shorten the banner, or move longer text below the grid. If a new collection has no scroll data yet, our free page leak scan predicts where attention lands on the first screen. It's a prediction, not your shoppers' behavior, but it shows where to look first.
3. The filter button gets clicks, but product clicks don't follow
Shoppers opened filters and then left or went back. Usually the filters didn't match how they choose, a combination returned nothing, or applying a filter reloaded the page and lost their place. Apply the three most common filters yourself on a phone. Baymard's testing found five filter types that should be offered where they apply: price, average user rating, color, size and brand (Baymard Institute, Product list and filtering). Your search reports for searches with no results show the words shoppers use when they can't find something.
4. Almost nobody touches filters on mobile
If desktop shoppers filter and mobile shoppers don't, the trigger may be hard to find: a small icon, or a button that scrolls away. Check that the filter and sort controls are visible on the first phone screen and stay in reach as shoppers scroll the grid. If your collections are small, low filter use can be fine. Shoppers just scroll.
5. Dead clicks on swatches, second images or ratings
Shoppers tap a color swatch expecting the card image to change, swipe a card expecting another angle, or tap the stars expecting reviews. Clarity marks clicks that produce no response as dead clicks. Make the element do what shoppers expect (switch the image, open the product on that color), or style it so it doesn't look clickable. Our guide to rage clicks and dead clicks covers how to tell them apart.
6. Rage clicks on filter values, sort or "Load more"
Fast repeated taps in one spot usually mean the page is slow to respond: a filter that reloads the whole page, or a "Load more" button that waits on a script. Test on a real phone over a slow connection before you change the design. Clarity flags clicks that happen right before a JavaScript error as error clicks, which helps you find broken controls.
7. Quick add gets clicks, product pages don't
If your cards have a quick add or quick view button, compare its clicks with clicks that open the product page. Many quick adds can be good, but if they lead to few completed orders, shoppers may be adding without the details they need (size, delivery, reviews) and then stopping at the cart. Compare orders from shoppers who used quick add with those who opened the product page, and watch a few session recordings that include the quick add click.
Common mistakes reading collection page heatmaps
- Reading filtered and unfiltered views together. Heat on a card in position three might belong to a dozen different products.
- Reading scroll percentages on infinite scroll as if the page had one length. Use rows reached, not percentages, where your tool allows.
- Treating the first row's heat as proof the first products are best. It may only show that they're first. Change the sort and see whether the clicks follow the products or the position.
- Judging the page by clicks alone. A collection page is a middle step. Judge changes by the share of collection visitors who open a product, then add to cart.
- Reading the busiest collection and applying it everywhere. A sale collection, a gift guide and a core category attract different shoppers. Check the template on the group and the products on each page.
Turn one pattern into one change
Pick the single pattern that affects the most shoppers near the top of the page, and write it down as a hypothesis with a number you can re-check. For example (illustrative): "On mobile, the first product card on our best-selling collection sits below the average fold, and the banner gets more taps than any product. Cut the banner to one line, and compare product views per collection visit over two equal weeks."
Our CRO hypothesis template gives you a format for writing these down. Most collections don't get enough traffic for a fast A/B test; CRO without A/B testing shows how to measure a before-and-after honestly. If you'd rather not run that re-measurement by hand, every Cortality plan re-measures each fix you ship; compare the plans. If shoppers open products but don't buy, our add to carts but no sales guide shows how to find the step that loses the most people.
Collection page heatmap checklist (copy this)
- Template questions read on a group of all collection pages
- Busiest or ad-linked collection read on its own
- Unfiltered and filtered or sorted views read separately
- Desktop and mobile read separately
- Large traffic sources (ads, email, homepage menu) read on their own
- A few hundred page views per device in the window
- Pagination, infinite scroll or "Load more" noted before reading the scroll map
- Filter drawer and quick view states noted before reading heat
- Click ranking sorted into products, filters and sort, exits and non-links
- Default sort order checked against where product clicks land
- First product card checked against the average fold on mobile
- Filter clicks compared with product clicks after filtering
- Dead clicks on swatches, images, ratings and badges listed
- Rage and error clicks on filters, sort and "Load more" tested on a real phone
- Quick add clicks compared with product page opens and orders
- One change shipped, re-measured over the same window length
Where Cortality fits
Most of this comes down to one question: what do shoppers actually see, skip and tap on your collection pages, and where do they stop? Cortality measures how real visitors use every part of your page, including the banner, the filter and sort controls and each product card, on each device. You get a ranked list of fixes, each with the evidence and the exact change to make, and after you ship a fix Cortality re-measures it and tells you whether it worked. It works alongside Google Analytics and Microsoft Clarity rather than replacing them. See how it works or what a finding looks like. For stores, see Cortality for Shopify stores.
For a quick first look, our free page leak scan takes about a minute and needs no install. It's a prediction from our attention model, not data from your real visitors, so use it to decide where to look first.
Plans are $99, $249 or $499 a month (Starter, Growth and Scale). Start your free week, and you see your first report before you pay. You save a card at signup, and nothing is charged until 3 days after your first report. Cancel before then and you pay nothing, and any charge can be refunded within 14 days. How the free week works.
Questions
What does a collection page heatmap show?
Where shoppers click and tap on a category or collection page, how far down the product grid they scroll, and which elements they click that aren't links. It shows whether they open products from the first row or keep browsing, whether they use filters and sorting, and which parts of the product cards they expect to do something.
Should I read one collection or all collection pages together?
Both, for different questions. Group all collection pages together to judge the template: the filter button, the sort menu and the product card layout are the same everywhere. Read your busiest collection on its own to judge the products, sort order and banner on that page.
Do filters and infinite scroll break collection page heatmaps?
They make them harder to read. A filtered or sorted view shows different products in the same positions, so heat on a card may belong to several products. Infinite scroll and load more change the page's length, so a scroll percentage means different things for different visitors. Read the unfiltered view first and note how the page loads more products.
How much traffic does a collection page heatmap need?
A few hundred page views per device in the window you're reading is a sensible minimum for one collection. If a single collection is too small, group all collections with the same template, and back up what you see with a few session recordings.