Landing Page Heatmap: 7 Patterns and What Each One Means
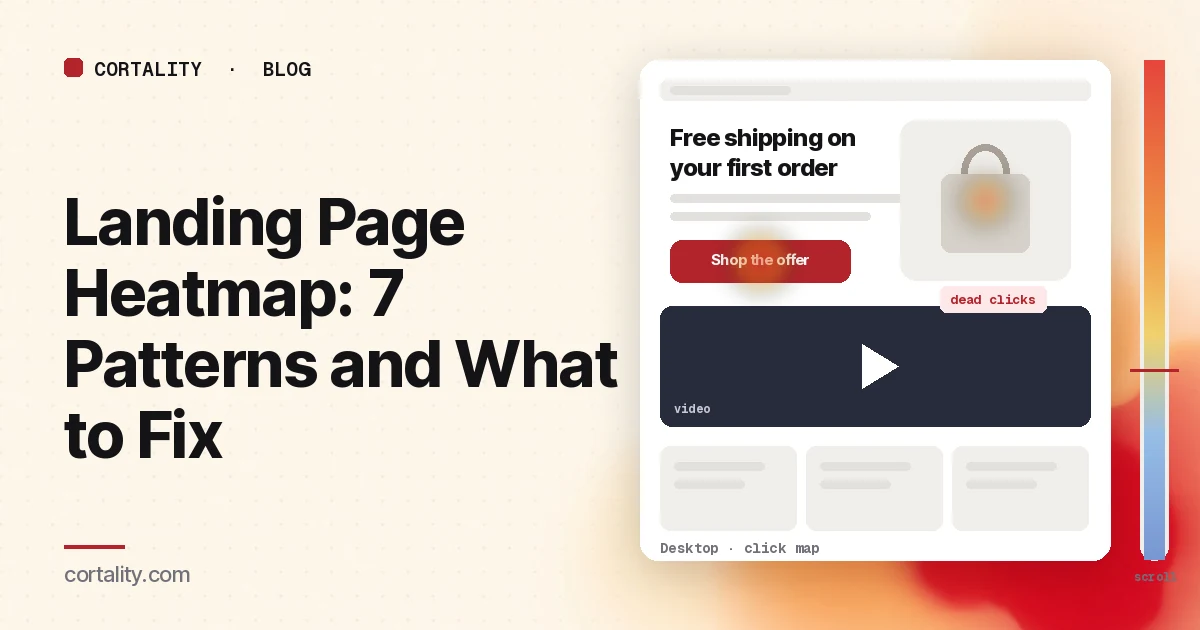
A campaign landing page has one job: get the visitor you paid for to take one action. When it doesn't, your ad platform shows clicks and your analytics shows a low conversion rate. A landing page heatmap shows what those visitors did on the page: whether they saw your button, what they tapped instead, and how far they read before they left.
This guide is about reading that data on pages built for ad, email or social traffic. If you're sending that traffic to a Black Friday or Cyber Monday sale page, the Black Friday landing page heatmap covers what to check before the spike. If you want a list of what the top of the page should include, read what to put above the fold on a landing page. For a broader look at what slows visitors down, see landing page friction. If you're new to heatmaps, how to read a website heatmap covers the basics first.
Set it up so the map means something
- Read one campaign at a time. Landing pages often get traffic from several ads or emails at once. Each makes a promise, and visitors arrive looking for it. Filter by UTM campaign or source if your tool supports it, or give each campaign its own URL parameter. Google's URL builders show how to tag links.
- Split by device. Most paid social traffic arrives on phones, and many search campaigns lean toward desktop. A two-column landing page becomes one long column on a phone. Read each device separately. Our guide to mobile vs desktop heatmaps explains why the maps differ.
- Use a long enough, fixed window. Aim for a few hundred page views per device per campaign, and keep the window the same length when you compare before and after a change. If a campaign is small, heatmaps on a low-traffic website covers what you can still read. Before a new campaign has any traffic, our free page leak scan predicts where attention lands on the page. It's a prediction, not your visitors' behavior, but it shows where to look first.
- Know the page's states. Popups, sticky bars, countdown timers and form steps change what visitors see. Clarity notes that a page impression might not show the element a user clicked (Microsoft Clarity, Click maps). Write down which state you're looking at.
- Write down the one action. A button, a form submit, a call, a booking. Every pattern below is judged against it.
Read the click map and scroll map together
Start with the click ranking. Clarity ranks elements by share of clicks, including things that aren't links, and lets you switch to first clicks, dead clicks and rage clicks. Then open the scroll map, which shows the share of visitors who reached each point and the average fold (Microsoft Clarity, Scroll maps). Note the share of visitors who reached your form, your proof and your second button.
Expect most attention near the top. In Nielsen Norman Group's eyetracking research, people spent about 57% of their page-viewing time above the fold and about 74% in the first two screenfuls (Nielsen Norman Group, Scrolling and Attention). On a campaign page, the first screen does most of the work.
7 landing page heatmap patterns, and what each usually means
The examples below are illustrative, to show what each pattern looks like. Your numbers will differ.
1. The main button gets few clicks, and nothing else gets many
The page is cold almost everywhere, and the scroll map shows most visitors leave within the first screen. People landed, didn't see what they came for, and left. This is usually a message match problem: the headline doesn't repeat the ad's promise, or the offer in the ad isn't visible on the first screen.
Example (illustrative): a Facebook ad promises "Free shipping on your first order," and the landing page headline talks about the brand's story. Put the ad's promise in the headline, and check the ad itself for traffic quality before redesigning the page.
2. Clicks go to the navigation or footer instead of the button
Campaign visitors click "About," "Pricing" or the logo. They want something the page didn't answer, so they went looking for it. Two fixes, often together: answer the question on the page (cost, what happens next, who it's for), and remove or trim the navigation on pages built for one action.
3. Dead clicks on images, product shots or bold text
Visitors tap a product image expecting a larger view, a screenshot expecting a demo, or a bold phrase expecting a link. Clarity marks clicks that produce no response as dead clicks. Either make the element do what people expect, or style it so it doesn't look clickable. Our guide to rage clicks and dead clicks covers how to tell them apart.
4. Rage clicks on the button or the form submit
Fast repeated clicks in one small spot usually mean something is slow or broken: a button that waits on a script, a form that fails silently, or a booking widget that takes seconds to load. Test the page on a real phone over a slow connection before you change the design. If the form loads from another service in an iframe, the heatmap may not see inside it.
5. A sharp scroll drop below a full-width section
The scroll map falls off a cliff right below a video block, a large image or a band of whitespace. Visitors took it for the end of the page. If your form, proof or second button sits below that point, most visitors never reach it. Move them up or break the section so it's clear more follows. Our scroll map guide covers how to tell a natural exit from a false bottom.
6. Many visitors reach the form, few start it
The scroll map shows a healthy share reaching the form, but the form fields get few clicks compared with the page views at that point. People saw what you asked for and decided it wasn't worth it. Look at the number of fields, any field that asks for something sensitive early (phone, budget), and whether the page says what happens after submit. Our guide to lead gen form fields covers which to cut.
7. Different campaigns, different maps
One campaign's map shows strong button clicks, another's shows clicks spread across the page and an early scroll drop. The page isn't the problem for everyone. The second campaign is sending visitors whose question the page doesn't answer. Either give that campaign its own version of the page, or change the ad so it sets the right expectation.
Common mistakes reading landing page heatmaps
- Reading all campaigns as one group. A strong campaign hides a weak one, and you end up redesigning a page that works for most of its traffic.
- Judging the bottom of the page by its colors. Cold color low on a long page is expected. Judge each section by the share of visitors who reached it and whether it needed to be seen.
- Chasing clicks instead of conversions. More clicks on the button only matter if more people complete the action. Check the conversion rate for the same window.
- Ignoring page speed. If visitors leave before the page finishes loading, the heatmap undercounts them. Check your page speed for the campaign's main device first.
- Changing several things at once. You won't know which change moved the number.
Turn one pattern into one change
Pick the single pattern that affects the most visitors near the top of the page, and write it down as a hypothesis with a number you can re-check. For example (illustrative): "On mobile, for the spring email campaign, the scroll map drops from most visitors to a small share right below the video block, and the form sits under it. Move the form above the video, and compare form submits per page view over two equal weeks."
Our CRO hypothesis template gives you a format for writing these down. If your campaign doesn't send enough traffic for a proper A/B test, CRO without A/B testing shows how to measure a before-and-after honestly. If you'd rather not run that re-measurement by hand, every Cortality plan re-measures each fix you ship; compare the plans. For a full step-by-step on the page itself, see how to improve landing page conversion rate.
Landing page heatmap checklist (copy this)
- The page's one action written down
- Traffic tagged by campaign, and each large campaign read on its own
- Desktop and mobile read separately
- A few hundred page views per device per campaign in the window
- Popup, sticky bar, timer and form-step states noted before reading heat
- Main button's share of first clicks noted
- Headline checked against the ad or email promise
- Navigation, logo and footer clicks from campaign visitors checked
- Dead clicks on images, screenshots and bold text listed
- Rage clicks on the button and form tested on a real phone
- Scroll share recorded for the form, proof and second button
- False floors checked below full-width sections
- Form reach compared with form starts
- One change shipped, re-measured over the same window length
Where Cortality fits
Most of this comes down to one question: what do campaign visitors actually see, skip and click on your landing page, and where do they stop? Cortality measures how real visitors use every part of your page, including the headline, the button, the form and each section below them, on each device. You get a ranked list of fixes, each with the evidence and the exact change to make, and after you ship a fix Cortality re-measures it and tells you whether it worked. It works alongside Google Analytics and Microsoft Clarity rather than replacing them. See how it works or what a finding looks like. For a page-by-page review, see our landing page CRO audit.
For a quick first look, our free page leak scan takes about a minute and needs no install. It's a prediction from our attention model, not data from your real visitors, so use it to decide where to look first.
Plans are $99, $249 or $499 a month (Starter, Growth and Scale). Start your free week, and you see your first report before you pay. You save a card at signup, and nothing is charged until 3 days after your first report. Cancel before then and you pay nothing, and any charge can be refunded within 14 days. How the free week works.
Questions
What does a landing page heatmap show?
Where visitors click and tap on a landing page, how far down they scroll, and which elements they click that aren't links. On a page built for one action, it shows whether people reach and use that action, what they click instead, and where they stop reading.
Should I read a landing page heatmap per campaign?
Yes, when one landing page gets traffic from several ads, emails or audiences. Each one makes a different promise, so visitors arrive with different questions. Mixed together, a campaign that works can hide one that doesn't.
What is a good click rate on a landing page button?
There's no single benchmark worth trusting, because it depends on the offer, the traffic and how much the page asks for. Compare the button's share of clicks and the page's conversion rate against your own earlier weeks, by campaign and device.
How much traffic do I need before reading a landing page heatmap?
Enough that each device has a few hundred page views per campaign in the date range you're reading. If a campaign sends less than that, read it over a longer window or combine it with similar campaigns, and back up what you see with session recordings.