Black Friday Landing Page Heatmap: What to Check on a Sale Page Before the Traffic Spike
A Black Friday or Cyber Monday landing page has a short life and a heavy job. For a few days it has to show the offer, when it ends, the shipping and returns terms, and a clear way into the products, to people who arrived from an ad, an email or a social post. Last year U.S. shoppers spent $11.8 billion online on Black Friday and $14.25 billion on Cyber Monday. Adobe forecasts $12.9 billion and $15.1 billion on those days this year, inside a $275.1 billion online holiday season from Nov. 1 to Dec. 31 (Adobe, 2025 holiday recap; Adobe, 2026 holiday forecast, Sept. 28, 2026). You don't get a quiet week to iterate once that traffic is live.
This guide is about reading a heatmap of that sale or campaign landing page before the spike, so you can fix the obvious problems while you can still change the page. It is not a build checklist. For a 12-point pre-launch list on Shopify, see Shopify Black Friday landing page. For heatmap patterns that apply to any campaign page, see landing page heatmap. For the rest of the store, from homepage banners through checkout, use the holiday ecommerce CRO checklist. If you're new to heatmaps, how to read a website heatmap covers the basics first.
Why read it before the traffic spike
Holiday traffic is compressed. Adobe expects Cyber Week, the five days from Thanksgiving through Cyber Monday, to drive $47.5 billion online this year, 17.3% of the full season. On Shopify's platform last year, sales peaked at $5.1 million per minute at 12:01 p.m. Eastern on Black Friday (Shopify, BFCM 2025). Your page has to make sense in that first screen, on a phone, under load.
Most of that spend will be on phones. Adobe forecasts that mobile will account for 57.4% of U.S. holiday online spend this season, and 63% on Thanksgiving Day. A desktop-only reading of last year's sale page will miss the version most people actually see.
If you wait until Friday morning to open the map, you are looking at a page you can barely change. Read it now, with the traffic you already have, and treat Black Friday as the exam, not the first practice.
What a Black Friday landing page heatmap shows
A heatmap adds up clicks and scrolls from many visits onto one screenshot of the page. Microsoft Clarity, a free analytics tool, will draw one from any amount of traffic, for a single page or a group of pages, and offers five kinds: click maps, scroll maps, area maps, conversion maps and attention maps (Microsoft Clarity, Heatmaps overview).
On a sale landing page, the click map is the place to start. It shows whether people use the "Shop the sale" button, whether they tap sale badges, countdowns, product tiles or compared prices, and whether first clicks go into the offer or out through the menu. Clarity ranks elements by clicks, including things that aren't links, and lets you switch to dead clicks, rage clicks, error clicks, first clicks and last clicks. You can open session recordings from any row (Microsoft Clarity, Click maps).
The scroll map shows the share of visitors who reached each point of the page, in 5% increments, and marks the average fold: how much of the page people saw before they started scrolling (Microsoft Clarity, Scroll maps). That is how you tell whether the product grid, a second button, or the shipping and exclusions copy actually got seen, especially on phones.
Conversion maps, if Clarity has detected purchase events on the project, show which clicks came before an order (Microsoft Clarity, Conversion maps). They are useful later, once sale traffic is flowing. They are not a substitute for reading the page before the spike.
Set it up so the map means something
- Use the traffic you already have. Last year's sale URL, if it still exists and still looks close to this year's page, is the best rehearsal. An early-access or early-bird version sent to a smaller list works too, as does a quiet launch of this year's page a week or more ahead of the ads. The point is to read real clicks on this layout, not to wait for Friday.
- Read one campaign at a time. Sale traffic often arrives from email, paid social, paid search and affiliates at once. Each message makes a slightly different promise. Filter by UTM campaign or source if your tool supports it, or give each campaign its own URL. Google's URL builders show how to tag links. If several sale URLs share one template, Clarity can group them so you read the template first, then the busiest URL on its own.
- Split by device. Read mobile and desktop separately. A two-column sale page becomes one long column on a phone, and the average fold moves. Our guide to mobile vs desktop heatmaps explains why the maps differ.
- Know the page's states. Countdown timers, sold-out tiles, "notify me" buttons, popups and sticky bars change what people see. Clarity notes that a page impression might not show the element a user clicked. Write down which state you're looking at, and open recordings when the screenshot and the click ranking disagree.
- Write down the one action. On most sale landing pages that is a click into a collection, a featured product, or a "Shop the sale" button. Every pattern below is judged against that action.
- Use a fixed, long enough window. Aim for a few hundred page views per device, and keep the window the same length when you compare before and after a change. If the page is still quiet, heatmaps on a low-traffic website covers what you can still learn. Before the page has any traffic, our free page leak scan predicts where attention will land. It's a prediction, not your visitors' behavior, but it shows where to look first.
Read the first screen first
Expect most attention near the top. In Nielsen Norman Group's eyetracking research, people spent about 57% of their page-viewing time above the fold, about 74% in the first two screenfuls, and 81% in the first three (Nielsen Norman Group, Scrolling and Attention). On a sale page, the first screen has to answer three questions: what is on sale, how much it is, and what to do next.
Check that the offer is specific. "Sale" or a seasonal graphic with no end date and no sense of the discount leaves people to guess. Adobe expects discounts this year of up to 14% in early November, up to 21% just before Thanksgiving, and up to 30% off listed price once Cyber Week starts. If your first screen doesn't say what is included, what is excluded, and when the offer ends, a low click rate on the shop button may be a copy problem, not a button problem.
Check that the shop button is visible on a phone. Open the mobile scroll map and note whether the main button sits above the average fold. If the first screen is a full-height hero, a countdown, or a looping video, the button may sit just below what most phones show. A low click count then means people never saw it.
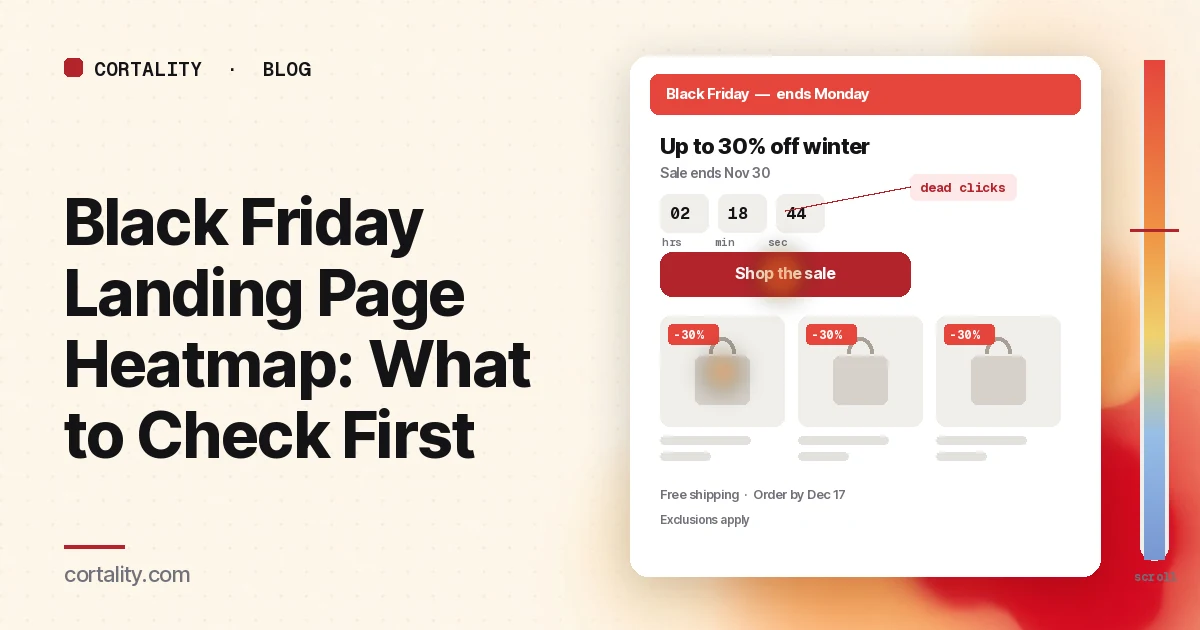
Watch the countdown and the sale badges. Dead clicks or rage clicks on a timer, a starburst, or a "50% off" badge usually mean people thought it was the way into the sale. If those elements aren't links, make the real button more obvious, or make the badge itself go to the right collection. If the countdown covers the button on a smaller phone, that is a layout bug, not a demand problem.
Compare first clicks on the offer with first clicks on the menu, logo or search. Campaign visitors who immediately leave the landing page through the navigation are often looking for a promise the first screen didn't keep, or they can't find a way into the products. The website navigation heatmap guide covers the menu side. A sale landing page can still have a header, but the first screen should not depend on it.
Then read the path into the products
Once people try to shop, the click ranking should show a path into collections or product tiles, not a dead end.
Most clicks on the first row of products or categories is healthy, as long as those tiles match the offer you advertised. If people skip the first row and click farther down, the featured set may be wrong for the traffic you paid for. Open your main ad and email, then look at what actually sits in that first row.
Dead clicks on product images, lifestyle shots or "up to X% off" cards mean people tried to open something that isn't a link. Make the whole card clickable, including the image and the discount label.
If the landing page is also a collection, read filters, sort and sold-out states on their own. A filter chip with dead or rage clicks may be broken on mobile. Sold-out products that still look like the offer will collect clicks and then drop people. The collection page heatmap guide covers that template in more detail.
Then read the terms people need before they buy
Sale traffic is less patient with surprises. In Baymard's research, 42% of U.S. online shoppers had abandoned a cart because they were just browsing. Among the remaining reasons, 40% pointed to extra costs (shipping, tax, fees), 20% to delivery that was too slow, 13% to an unsatisfactory returns policy, and 12% to not being able to see or calculate the total order cost up front (Baymard Institute, Cart abandonment rate, updated Oct. 28, 2026).
On the landing page, that means shipping, order-by dates, returns, gift options and exclusions have to be findable before someone hits the cart. Open the scroll map and the click ranking together:
- If almost no one reaches the terms block, it sits too low, or a full-width section is acting as a false floor.
- If people click "free shipping" or "arrives before Christmas" and nothing happens, the line looks like a link and goes nowhere. Point it at a short explanation, or put the actual cutoff on the page. Our holiday shipping cutoff dates guide covers how to set that date and where to show it.
- If last clicks happen on an asterisk or a tiny exclusions line, people are trying to find out what the sale does not include. Put the important exclusions in plain language near the offer, not only in a footnote.
The cart page heatmap will show whether those costs then surprise people later. Fix the landing page first if the terms were never seen.
Then read the scroll map
After the click ranking, sit with the mobile scroll map for a minute.
Note the average fold and the share of visitors who reach the product grid, the second button, and the terms. If the grid that holds the actual sale items starts below a long hero, many people will leave without seeing a product. If a second call to action at the bottom gets almost no reach, it isn't a second chance; it is decoration.
Watch for false floors: a full-width countdown, a video, or a hard edge that makes the page look finished. Nielsen Norman Group has long warned that the illusion of completeness can stop people scrolling. A sliver of the next section, or a product row that is obviously cut off, is a fair signal that more exists below.
Common mistakes reading a sale-page heatmap
Waiting for Black Friday to have "enough data." The weekend is when you can least afford to learn a basic layout problem. Rehearse with earlier traffic.
Mixing every sale URL into one map. A "last chance" email page and a paid-social page can share a template and still make different promises. Read the group for the template, then the busiest campaign on its own.
Reading desktop and calling it done. With mobile forecast to carry most of the season's online spend, the phone map is the one that has to work.
Changing the offer and the layout at the same time. If the button finally gets clicks after you also rewrote the headline, moved the hero and shortened the countdown, you will not know which change mattered.
Ignoring sold-out and "notify me" states. A heatmap screenshot is often taken from one recording. If popular sale items are gone, the map may show a page your Friday visitors will not see. Check that state on purpose.
Turn one pattern into one change
Pick one pattern, write down what you think it means, make one change, and re-measure over a window of the same length. For example: "On the early-access sale page, fewer than half of mobile visitors reached the product grid, and the shop button sat below the average fold. If we move the button and the first product row above the fold, the click rate on Shop the sale should rise in the next seven days, on mobile only."
Our CRO hypothesis template gives you a format for writing these down. If you will not have enough sale traffic for a proper A/B test, CRO without A/B testing shows how to measure a before-and-after honestly. If you'd rather not run that re-measurement by hand, every Cortality plan re-measures each fix you ship; compare the plans.
Black Friday landing page heatmap checklist (copy this)
- Traffic source chosen: last year's sale URL, early-access page, or a quiet launch of this year's page
- One campaign read at a time; shared templates grouped, then the busiest URL on its own
- Desktop and mobile read separately
- Page states noted: countdown, sold-out tiles, popups, sticky bars
- One action written down (usually Shop the sale, a collection, or a featured product)
- First screen checked: specific offer, end date, button above the average fold on a phone
- Dead and rage clicks on badges, countdowns and non-linked images listed
- First clicks on the offer compared with first clicks on the menu, logo and search
- Path into products checked: first-row tiles, whole cards clickable, sold-out states
- Shipping, order-by date, returns, gifts and exclusions visible without a long scroll
- Mobile scroll map checked: product grid, second button and terms vs the average fold
- One change shipped, re-measured over the same window length
Where Cortality fits
Most of this comes down to one question: what do visitors actually see, skip and tap on your sale landing page, and where do they give up? Cortality measures how real visitors use every part of your page, including the offer, the shop button, the product tiles and the terms, on each device. You get a ranked list of fixes, each with the evidence and the exact change to make, and after you ship a fix Cortality re-measures it and tells you whether it worked. It works alongside Google Analytics and Microsoft Clarity rather than replacing them. See how it works or what a finding looks like. For online stores, see Cortality for Shopify stores.
For a quick first look, our free page leak scan takes about a minute and needs no install. It's a prediction from our attention model, not data from your real visitors, so use it to decide where to look first.
Plans are $99, $249 or $499 a month (Starter, Growth and Scale). Start your free week, and you see your first report before you pay. You save a card at signup, and nothing is charged until 3 days after your first report. Cancel before then and you pay nothing, and any charge can be refunded within 14 days. How the free week works.
Questions
What does a Black Friday landing page heatmap show?
Where visitors click or tap on your sale or campaign landing page, how far they scroll, and which elements they click that don't respond. On a Black Friday or Cyber Monday page that usually means whether people use the shop button, whether they tap sale badges, countdowns or product tiles, whether they leave through the menu, and whether shipping, returns or exclusions sit below the fold.
When should I look at the heatmap if the sale hasn't started?
Use the traffic you already have. That can be last year's sale URL if it still exists, an early-access or early-bird version of this year's page, or a soft launch of the page to a smaller list before you spend on ads. A map from a few hundred visits per device is more useful than waiting until Black Friday, when you can barely change the page.
How is this different from a regular landing page heatmap?
The way you read the map is the same: clicks, scroll depth and the one action you want. What changes is the page itself, and the clock. A sale page has compared prices, countdowns, gift and shipping lines, and exclusions that a normal campaign page often doesn't, and the traffic arrives in a few short days. Read the sale-specific elements and do it before the spike. For general campaign-page patterns, see the landing page heatmap guide.
How much traffic does a Black Friday landing page heatmap need?
A few hundred page views per device in the window you're reading is a sensible minimum. Microsoft Clarity will draw a heatmap from any amount of traffic, but a map from a few dozen visits mostly shows those few people. If the sale page is still quiet, read a longer window, watch a few session recordings, or run a predicted leak scan to decide where to look first.