Cart Page Heatmap: Where Shoppers Pause Before Checkout
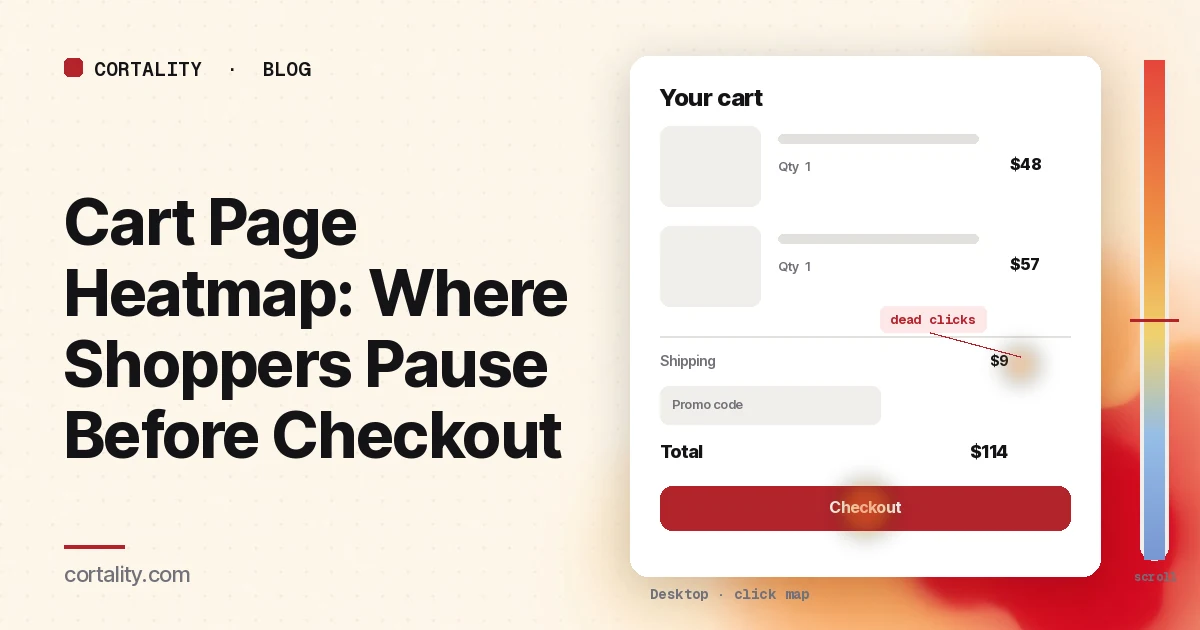
The cart is the pause between "I want this" and "I'll pay for it." Shoppers check the items, change a quantity, look for shipping and tax, and decide whether to continue. A lot of them don't. Baymard Institute's average of 50 published studies puts the documented cart abandonment rate at 70.22%, and in its survey 42% of US online shoppers said they had abandoned a cart because they were just browsing (Baymard Institute, Cart abandonment rate). The rest of the reasons are often visible on this page: costs, delivery, and whether the total is even shown.
A cart page heatmap is the way to see what those shoppers actually do here, before they reach the payment form. It is not the same thing as a checkout page heatmap. The checkout is where people type and pay. The cart is where they review and hesitate. Read them separately. To see how the cart fits with the homepage, collection and product pages, use our ecommerce heatmap guide.
First, know what a heatmap can record in the cart
Unlike hosted checkout, the cart page usually runs on your own domain, so your heatmap script can run on it. A few setups still hide part of the picture:
- Cart drawers and mini-carts. Many stores open a slide-out cart on the product page instead of sending shoppers to a /cart URL. Clicks inside that drawer won't show correctly on a screenshot of the product page. Read the drawer as its own state, or send people who are ready to pay to a full cart page you can map.
- Shipping and tax that load late. Estimates often appear only after a zip code, or after the page finishes a lookup. Clarity notes that a page impression might not show the element a user clicked (Microsoft Clarity, Click maps). Write down whether your screenshot shows the estimate, a blank "calculated at checkout" line, or an error.
- Upsells and cross-sells. Recommended products, progress bars toward free shipping, and gift-wrapping options change the length and the click ranking. If one of those is new, compare a window with it against a window without it, rather than mixing them.
- The payment page that follows. If checkout runs on your provider's domain, or in a Shopify sandbox, the heatmap stops at the cart. That's expected. Track checkout steps as events, and use this guide for the page you can still see. The checkout page heatmap guide explains those limits.
Set it up so the map means something
- Split the cart page from checkout, and from the drawer. The cart page (or drawer) is where people review, change quantities and look for costs. The checkout is where they type and pay. Read each on its own.
- Split by device. On a phone the order summary, shipping estimate and discount field often stack below the line items, and the checkout button can sit above or below that stack depending on the theme. Read desktop and mobile separately. Our guide to mobile vs desktop heatmaps explains why the maps differ.
- Split by where shoppers came from. People who arrived from a discount email behave differently from people who added an item from an ad. If one source is large, read it on its own.
- Track the steps as events. A heatmap shows behavior on the cart. To see how many shoppers reach it, leave it, or continue, you need events in your analytics. Google Analytics 4's recommended ecommerce events include add_to_cart, view_cart, begin_checkout and purchase (Google Analytics, Measure ecommerce). Check which ones arrive, especially view_cart if you use a drawer rather than a cart URL.
- Use a long enough, fixed window. Aim for a few hundred cart page views per device, and keep the window the same length when you compare before and after a change. Leave out sale days unless they're what you're studying; for a season-wide pass, see the holiday ecommerce CRO checklist. If your traffic is small, heatmaps on a low-traffic website covers what you can still read. For a first look at a new theme or cart layout, our free page leak scan predicts where attention lands. It's a prediction, not your visitors' behavior, but it shows where to look first.
Read the click map as a ranked list
Cart pages are short and dense, so the ranking tells you more than the colors. Clarity ranks clicked elements by share of clicks, including things that aren't links, and lets you switch to dead clicks, rage clicks, error clicks and last clicks (Microsoft Clarity, Click maps). Sort the top elements into five groups:
- Line items (product links, thumbnails, variant text)
- Quantity and remove (plus/minus, quantity fields, trash or "remove" links)
- Cost lines (subtotal, shipping, tax, discounts, total)
- Discount and shipping tools (promo code field, zip or country estimator, delivery-option links)
- Ways to continue or leave (checkout button, "continue shopping," login, menu, recommended products)
Then ask what each group is telling you.
Checkout should be the top action. If it isn't, something else is pulling attention: a promo field, a shipping estimator that looks like a form to finish, or a recommended product that sends people back into the catalog. That's not always a problem, but it should be a conscious one.
Quantity and remove clicks are questions. A lot of quantity changes can mean shoppers are testing a free-shipping threshold, or that the quantity picker on the product page didn't work. A lot of removes, especially right after shipping appears, often means the total was a surprise. Follow those clicks with a few session recordings rather than guessing.
Dead clicks on the shipping or total line matter more than almost anything else. Among shoppers who weren't just browsing, 40% in Baymard's survey said they had abandoned because extra costs (shipping, tax, fees) were too high, and 12% said they couldn't see or calculate the total order cost up front (Baymard Institute, Cart abandonment rate). If people click the shipping line and nothing happens, they may think they can open an estimate and can't. Show an estimate on the cart (and earlier, on the product page) instead of waiting for checkout.
Discount field clicks followed by an exit are a warning. A visible "promo code" box can send shoppers off the site to search for a code. If last clicks pile up on that field, and those sessions don't reach begin_checkout, hide the field behind a short link such as "Have a code?" and watch the same window again.
"Continue shopping" and menu exits can be healthy (adding another item) or a leak (the total scared them). Check what they open next, and whether they come back to the cart in the same session.
Then read the scroll map
Carts are often short, so a scroll map is easy to skip. Don't, especially on mobile. Clarity shows the share of visitors at each 5% of page height, the drop-off at each point, and the average fold (Microsoft Clarity, Scroll maps).
Check two things:
- Whether the checkout button and the total are above the average fold. On a phone, two line items, a progress bar and a recommended product can push the button below the first screen. Shoppers who don't scroll never start checkout.
- Whether people reach upsells or policy links below the button. If a cross-sell or a returns note sits under the button and almost nobody gets there, it isn't helping, and it may be making the page feel longer than it is. Nielsen Norman Group's 2018 eyetracking study found people spent about 57% of their page-viewing time above the fold, 74% in the first two screenfuls, and 81% in the first three (NN/g, Scrolling and Attention). Put the total and the checkout button where that time already is.
A scroll map is also a check on GA4. Enhanced measurement fires a scroll event only the first time a visitor reaches 90% of the page (Google Analytics, Enhanced measurement events). That won't tell you whether they saw the button at 40%. Use the map for that.
Common mistakes reading cart page heatmaps
- Mixing the cart and checkout into one map. They have different jobs and, on many stores, different domains. You'll hide the shipping-estimate problem on the cart, or you'll read an empty checkout map as "nobody uses this page."
- Reading the drawer on a product-page screenshot. Clicks in a slide-out cart land on whatever the screenshot shows underneath. Filter to the cart URL, or capture a screenshot with the drawer open.
- Treating every abandoned cart as a broken cart. Baymard's survey found 42% of US online shoppers had abandoned because they were just browsing (Baymard Institute, Cart abandonment rate). Compare your cart-to-checkout rate against your own past weeks, and spend your time on the patterns you can actually fix: missing totals, dead shipping clicks, a button below the fold.
- Calling a hot discount field a success. Clicks mean people noticed it. If those sessions don't continue to checkout, the field may be sending them away.
- Ignoring mobile. Quantity steppers, zip fields and stacked totals all change on a small screen. A cart that looks fine on desktop can be the worst step on a phone.
If add-to-cart volume is healthy but few carts become orders, our guide to add to carts but no sales walks through that wider case, including product-page and checkout causes.
Turn one pattern into one change
Pick the single pattern that affects the most cart visitors, and write it down as a hypothesis with a number you can re-check. For example (illustrative): "On mobile, dead clicks concentrate on the shipping line, the total says 'calculated at checkout,' and the share of view_cart sessions that reach begin_checkout is much lower than on desktop. Show an estimated shipping cost on the cart, and compare begin_checkout events per view_cart over two equal weeks."
Our CRO hypothesis template gives you a format for writing these down. If your store doesn't send enough traffic for a proper A/B test, CRO without A/B testing shows how to measure a before-and-after honestly. If you'd rather not run that re-measurement by hand, every Cortality plan re-measures each fix you ship; compare the plans.
Cart page heatmap checklist (copy this)
- Cart page (or open drawer) read separately from checkout
- Desktop and mobile read separately
- Large traffic sources (ads, email, discount campaigns) read on their own
- A few hundred cart page views per device, no sale days inside the window unless that's the study
- Click ranking sorted: line items, quantity/remove, cost lines, discount/shipping tools, continue or leave
- Dead and last clicks checked on the shipping line, total and promo field
- Scroll map checked: checkout button and total against the average fold
- view_cart and begin_checkout events arriving in analytics
- One change shipped, re-measured over the same window length
Where Cortality fits
Most of this comes down to one question: what do shoppers actually see, skip and tap on your cart, and where do they stop? Cortality measures how real visitors use every part of your page, including the line items, the shipping line, the discount field and the checkout button, on each device. You get a ranked list of fixes, each with the evidence and the exact change to make, and after you ship a fix Cortality re-measures it and tells you whether it worked. It works alongside Google Analytics and Microsoft Clarity rather than replacing them. See how it works or what a finding looks like. For stores, see Cortality for Shopify stores.
For a quick first look, our free page leak scan takes about a minute and needs no install. It's a prediction from our attention model, not data from your real visitors, so use it to decide where to look first.
Plans are $99, $249 or $499 a month (Starter, Growth and Scale). Start your free week, and you see your first report before you pay. You save a card at signup, and nothing is charged until 3 days after your first report. Cancel before then and you pay nothing, and any charge can be refunded within 14 days. How the free week works.
Questions
What does a cart page heatmap show?
Where shoppers click and tap on your cart page or cart drawer, how far they scroll, and which elements they click that aren't links. It shows whether they change quantities, hunt for a discount, interact with the shipping or total line, and whether they click checkout or leave.
What's the difference between a cart heatmap and a checkout heatmap?
The cart is where people review items, change quantities and look for costs. The checkout is where they type an address and pay. Read each on its own. On many stores you can only draw a heatmap of the cart, because hosted or sandboxed checkout pages block your script, so the cart is often the last page you can actually see.
Can I put a heatmap on a cart drawer or mini-cart?
Sometimes, but don't mix it with the full cart page. A drawer is a different layout, usually shorter, and it appears on top of another page. Filter or segment drawer views separately, or read the full cart page (the URL shoppers reach when they open /cart) as its own map. A screenshot of the product page won't show clicks that happened inside a closed drawer.
How much traffic does a cart page heatmap need?
A few hundred cart page views per device in the window you're reading is a sensible minimum. Tools like Microsoft Clarity will draw a map from any amount of traffic, but a map from a few dozen visits mostly shows those few shoppers. If your cart traffic is small, use a longer window and back the map up with a few session recordings.