Checkout Page Heatmap: Where Buyers Stop Before Paying
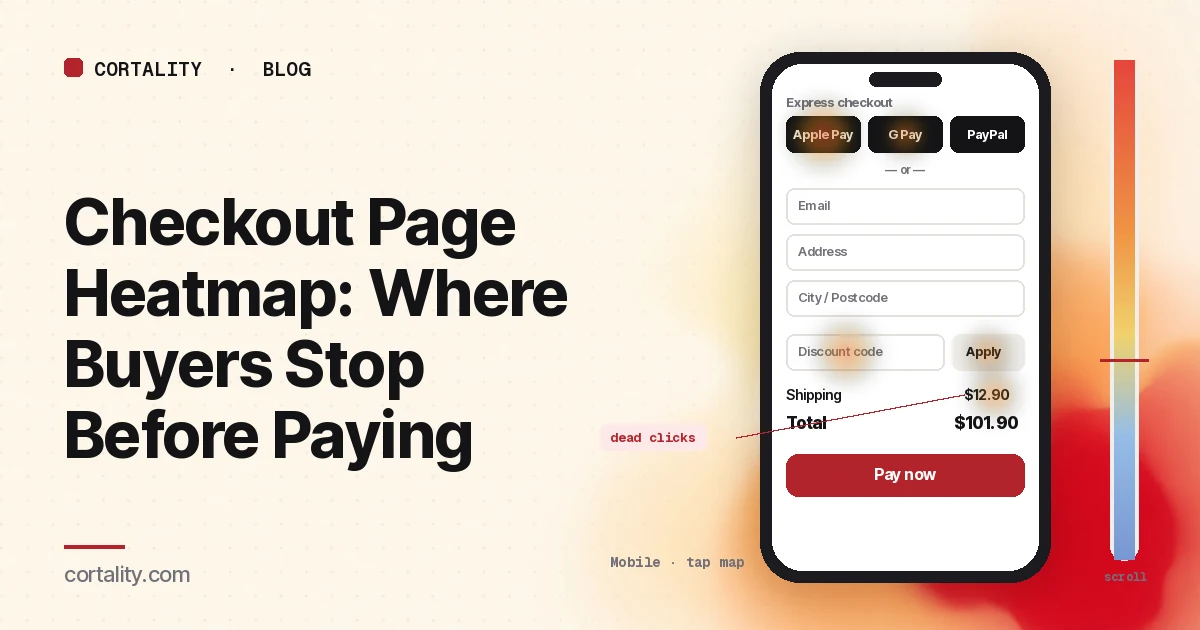
A shopper picked a product, added it to the cart and clicked "Checkout." Then they left. Your analytics shows the checkout step and the missing order. A checkout page heatmap shows what happened in between: whether they reached for Apple Pay or the form, whether they went looking for a discount code, and whether the shipping cost was the last thing they clicked near.
Leaving at checkout is common. Baymard Institute's average of 50 published studies puts the documented cart abandonment rate at about 70%, and in its survey 42% of US shoppers said they had abandoned simply because they were browsing (Baymard Institute, Cart abandonment rate). A heatmap won't bring those browsers back. It helps you find the buyers who meant to pay and hit something on the way.
This guide is about reading that data. If you run Shopify and want the settings that control fields, express buttons and accounts, start with Shopify checkout optimization. If you're not sure the problem is at checkout yet, add to cart but no sales shows how to find the step that loses the most people.
First, know what a heatmap can record at checkout
Checkout is the page where heatmap tools see the least. Check this before you look for patterns, or you'll read an empty map as a page nobody used.
- Hosted checkouts. If the payment page runs on your provider's domain (Stripe Checkout, PayPal, many "buy now" links), your heatmap script isn't on it. You can only read the page that sends people there.
- Shopify checkout. Shopify loads custom pixels in a sandbox: an iframe that can't access the top page, so pixels that rely on reading the page's layout don't work (Shopify, About web pixels). Pixels can still receive checkout events, such as when checkout starts and when shipping or payment info is submitted. Use those for step-by-step drop-off, and use the heatmap on your cart page or cart drawer.
- Payment fields. Card fields usually load inside an iframe from the payment provider. Microsoft Clarity captures clicks in same-domain iframes but not in third-party ones, and can't render what's inside them (Microsoft Clarity, FAQ). Expect a blank box where the card form sits.
- Typed content. Clarity masks the content of input boxes and drop-downs in all masking modes (Microsoft Clarity, Masking content). You'll see clicks on the address field, not the address. That's the right default.
If you run your own checkout (a custom build, WooCommerce, or a SaaS billing page on your own domain), you can read most of the page directly. The rest of this guide applies to whatever part of cart and checkout you can see.
Set it up so the map means something
- Split cart and checkout. The cart page (or drawer) is where people review, change quantities and look for costs. The checkout is where they type and pay. Read each on its own. Our cart page heatmap guide covers the review step.
- Split by device. On a phone the order summary often collapses behind a "Show order summary" link, express buttons stack at the top, and the keyboard covers half the form. Read desktop and mobile separately. Our guide to mobile vs desktop heatmaps explains why the maps differ.
- Split by where buyers came from. Shoppers who arrived from a discount email behave differently from shoppers who came from an ad. If one source is large, read it on its own.
- Use a long enough, fixed window. Aim for a few hundred checkout page views per device, and keep the window the same length when you compare before and after a change. Leave out sale days unless they're what you're studying; for a season-wide pass, see the holiday ecommerce CRO checklist. If your traffic is small, heatmaps on a low-traffic website covers what you can still read. While you wait for data, our free page leak scan predicts where attention lands on the product page that sends buyers to checkout. It's a prediction, not your visitors' behavior, but it shows where to look first.
- Know the page's states. Checkouts change as people use them: shipping options appear after the address, errors appear after submit, a discount line appears after a code. Clarity notes that a page impression might not show the element a user clicked (Microsoft Clarity, Click maps). Write down which state you're looking at.
Read the click map as a ranked list
Checkout pages are short and dense, so the ranking tells you more than the colors. Clarity ranks clicked elements by share of clicks, including things that aren't links, and lets you switch to dead clicks, rage clicks, error clicks and last clicks. Sort the top elements into four groups:
- Ways to pay (express buttons such as Apple Pay, Google Pay, PayPal or Shop Pay, and the main "Continue" or "Pay" button)
- Form fields (email, address, shipping options, and any checkboxes)
- Links that leave the page (return to cart, the logo, shipping or returns policy, "continue shopping")
- Things that aren't links (the order total, a shipping line, product thumbnails, trust badges)
Express buttons vs the form
Compare clicks on each express button with clicks into the first form field. Neither number is good or bad by itself. What to look for:
- Many express clicks but few express orders. The click opened a payment sheet or popup, and some buyers stopped there. Compare orders by payment method in your store's reports, and watch a few session recordings that include the click.
- Few express clicks on mobile, and most buyers typing a full address. Check whether the express buttons sit above the average fold on phones. If they're below a long order summary, many buyers never see them.
The discount code field
A visible coupon box tells every buyer a discount exists somewhere. On a heatmap, look for:
- Heavy clicks on the code field from buyers who then leave. Check the last-click map. If "Discount code" or a link to your homepage is a common last click, some buyers went to search for a code and didn't come back.
- Rage clicks on "Apply". A code was rejected and the buyer tried again. Check that the error message says why (expired, minimum not met, wrong product) and test your active codes on a phone.
If this pattern is strong, consider collapsing the field behind a small "Have a code?" link, or apply codes automatically from your campaign links so buyers don't need to type them.
Costs and the order total
Extra costs were the most common fixable reason in Baymard's survey: 40% of shoppers who weren't just browsing said shipping, tax or fees were too high, and 12% said they couldn't see or calculate the total up front (Baymard Institute, Cart abandonment rate). On the map, cost problems look like:
- Dead clicks on the shipping line or the total. Buyers tapped the number expecting a breakdown. Show what the total includes, or link "Shipping" to the rates.
- Last clicks right after shipping options appear. If buyers leave from the shipping step, the first time they saw the shipping cost was probably here. Show an estimate on the product or cart page.
- Clicks on "Shipping policy" or "Returns". These are questions about cost and risk. Put the one-line answer next to the button and keep the link for the full text.
Links that leave the page
The last-click map shows where buyers went when they left. "Return to cart" is often fine, because buyers change quantities. Clicks on the logo or "continue shopping" from the checkout are worth a look, because they usually mean the buyer wasn't ready to pay or wanted to check something. Watch a few recordings that end on those clicks before you remove any link.
Fields: hand off to form analytics
A heatmap shows which fields get clicked. It doesn't show which field buyers left on, how long they spent on it, or which one caused an error. For that, use your checkout's step events, form analytics, or form abandonment analysis. Two heatmap signals are still worth noting:
- Several clicks per page view on one field. Usually an error and a retry: a postcode that won't validate, a phone number format, or an address lookup that picks the wrong result. Test that field with real addresses from your top countries.
- A field nobody clicks. If "Company" or a second address line gets almost no clicks and it's optional, consider hiding it behind a link. Baymard's checkout research found the average US checkout shows 14.88 form fields by default, against 7 to 8 in an ideal flow (Baymard Institute, Cart abandonment rate).
Common mistakes reading checkout page heatmaps
- Reading a blank payment area as "nobody used it." Third-party payment iframes don't show up. Check orders by method instead.
- Reading one state. Shipping options, errors and discount lines change the page. Heat on an element that isn't in the screenshot lands on whatever was there instead.
- Counting express button clicks as orders. The click opens the payment sheet. The order is a separate number.
- Ignoring browsers. Many people who reach checkout were never going to pay that day. Judge changes by orders per checkout started, not by abandonment alone.
- Changing the checkout before the cart. If buyers first see costs at checkout, the fix often belongs on the product page or cart. Our product page heatmap guide covers that page.
Turn one pattern into one change
Pick the single pattern that affects the most buyers closest to paying, and write it down as a hypothesis with a number you can re-check. For example (illustrative): "On mobile, the shipping line is the most dead-clicked element on the checkout page, and a large share of last clicks happen right after shipping options load. Show a shipping estimate in the cart, and compare orders per checkout started over two equal weeks."
Our CRO hypothesis template gives you a format for writing these down. Checkouts rarely have enough traffic for a fast A/B test on a small store; CRO without A/B testing shows how to measure a before-and-after honestly. If you'd rather not run that re-measurement by hand, every Cortality plan re-measures each fix you ship; compare the plans.
Checkout page heatmap checklist (copy this)
- Confirmed which pages the heatmap script can run on (cart, checkout, payment)
- Checkout step events set up where the heatmap can't run
- Cart and checkout read separately
- Desktop and mobile read separately
- Large traffic sources (email, ads) read on their own
- A few hundred page views per device in the window, with no sale days inside it
- Shipping, error and discount states noted before reading heat
- Click ranking sorted into ways to pay, fields, exits and non-links
- Express button clicks compared with orders by payment method
- Express buttons checked against the average fold on mobile
- Discount field clicks and last clicks checked, and "Apply" tested
- Dead clicks on shipping, totals and badges listed
- Field retries checked with form analytics or step events
- One change shipped, re-measured over the same window length
Where Cortality fits
Most of this comes down to one question: what do buyers actually see, skip and tap on the pages before they pay, and where do they stop? Cortality measures how real visitors use every part of your page, including the cart, the buttons and the costs shown around them, on each device. You get a ranked list of fixes, each with the evidence and the exact change to make, and after you ship a fix Cortality re-measures it and tells you whether it worked. It works alongside Google Analytics and Microsoft Clarity rather than replacing them. See how it works or what a finding looks like. For stores, see Cortality for Shopify stores.
For a quick first look, our free page leak scan takes about a minute and needs no install. It's a prediction from our attention model, not data from your real visitors, so use it to decide where to look first.
Plans are $99, $249 or $499 a month (Starter, Growth and Scale). Start your free week, and you see your first report before you pay. You save a card at signup, and nothing is charged until 3 days after your first report. Cancel before then and you pay nothing, and any charge can be refunded within 14 days. How the free week works.
Questions
What does a checkout page heatmap show?
Where buyers click and tap on your cart and checkout pages, how far they scroll, and which elements they click that aren't links. It shows whether people use express payment or the form, whether they hunt for a discount code, and which links pull them out of checkout before they pay.
Can I put a heatmap on a Shopify or Stripe checkout?
Usually not on the payment page itself. Stripe's hosted checkout runs on Stripe's domain, so your script isn't there. Shopify loads custom pixels in a sandboxed iframe that can't access the checkout page, so tools that need the page's layout can't draw a heatmap of it. Read the cart page with a heatmap and track each checkout step as an event instead.
Can a heatmap see card numbers or addresses?
It shouldn't. Card fields usually sit inside an iframe from the payment provider, which tools like Microsoft Clarity can't capture, and Clarity masks the content of input boxes in every masking mode. You see that someone clicked a field, not what they typed.
How much traffic do I need before reading a checkout page heatmap?
Enough that each device has a few hundred checkout page views in the date range you're reading. Checkout gets far less traffic than product pages, so most small stores need a longer window and a few session recordings to back up what the map suggests.