Landing Page Friction: How to Find Conversion Friction Points and Fix Them
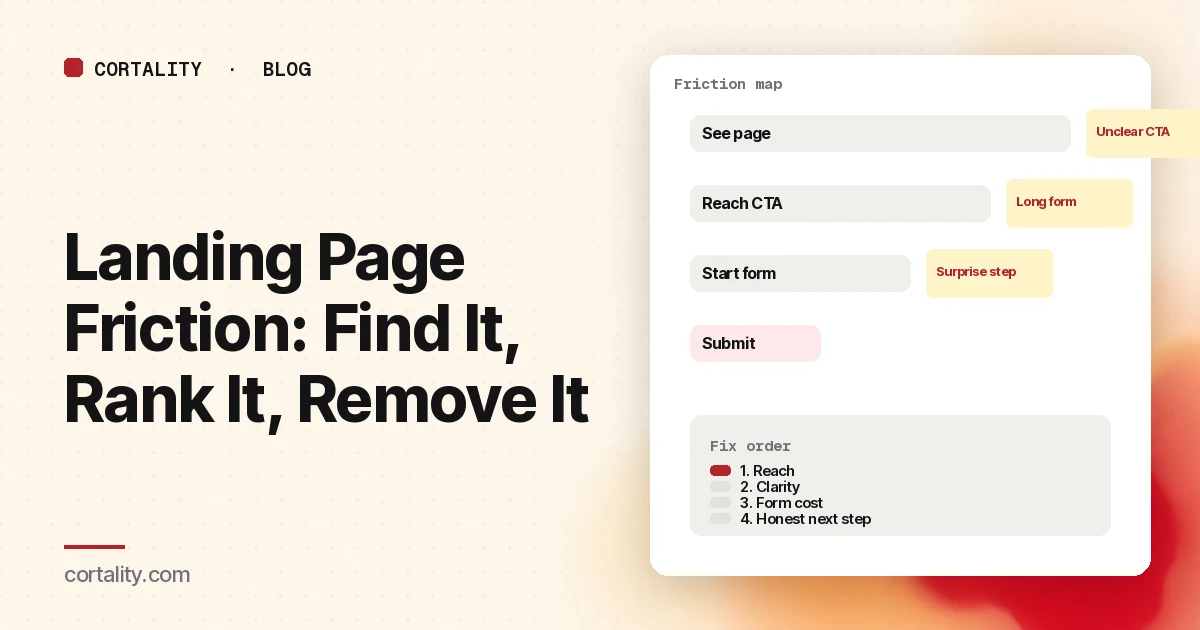
A landing page can look polished and still leak. The headline is clear, the traffic fits, and visitors still stop. What's left is usually friction: small costs that stack until the next step feels harder than it's worth.
This guide defines landing page friction, lists the conversion friction points that show up most often, and gives you a way to find, rank and remove them without redesigning the whole page.
What counts as friction
Friction is any extra effort, doubt or delay between "I'm interested" and "I did the thing." It isn't the same as a weak offer. A weak offer fails even on a smooth path. Friction is what trips people who already match what you sell.
Common shapes:
- Effort: more fields, more clicks, more scrolling than the decision needs
- Uncertainty: unclear what happens next, what it costs, or whether the page is trustworthy
- Delay: slow loads, broken controls, waiting for a step that could have been skipped
- Surprise: a sales call, a card charge, or a permission you didn't mention next to the ask
One of those can be tolerable. Several in a row feel like a wall.
The friction points worth checking first
Work in the order a visitor hits them. Our broader checklist of why a landing page isn't converting covers the same path; this list zooms in on friction.
1. The first screen doesn't confirm the promise
If the ad or search query said one thing and the hero says another, visitors spend their first seconds resolving the mismatch instead of deciding. That mental work is friction before they've scrolled.
Check: open your top traffic source next to the page. Does the headline repeat the same promise in plain words?
2. The main next step is hard to see or hard to tap
A button below the fold on phones, a ghost button that looks like a label, or three equally loud actions all raise the cost of starting. See CTA button placement for reach vs clarity.
Check: on a real phone, is the primary action visible without scrolling, clearly a button, and labeled with the outcome?
3. Proof sits too far from the ask
Visitors deciding at the button shouldn't have to hunt for a reason to believe you. Proof buried in a footer creates back-and-forth scrolling, which is effort with no reward if they never find it.
Check: is one specific, checkable proof visible near the primary CTA?
4. The form asks for more than the first step needs
Every field is a small reason to stop. Baymard's checkout research found that field count matters more than step count for how hard a flow feels, and that the average checkout still carried more fields than most sites need (11.3 on average in 2024, against roughly 8 needed on many sites), with 17% of users reporting they'd abandoned because checkout felt too complex (Baymard, Minimize Form Fields). Lead forms aren't checkouts, but the same cost logic applies: each extra ask is friction you should be able to justify.
Check: list every field and ask whether you need it before the first conversation. Our guides to lead gen form fields and form abandonment analysis cover what to cut and how to see where people quit.
5. The outcome after the click is a surprise
"Start free trial" that opens a sales calendar, or "Get pricing" that demands a card, trains people to bounce next time and loses the ones who feel tricked now.
Check: say what happens next in one honest line beside the button. If a card, a call or a wait is required, say so.
6. Speed and stability on phones
A slow hero, a layout that jumps as someone taps, or a form that clears on error adds delay and rework. Visitors experience that as friction even when the offer is fine.
Check: run the page through PageSpeed Insights on mobile, and submit the form yourself on a real phone.
7. Competing exits on a page that should have one job
Nav links, popups, chat and secondary offers are useful on a homepage and costly on a focused landing page. Each one is another path away from the conversion.
Check: decide the single action the page exists for. Tone down or remove the rest for paid or campaign traffic.
How to run a website friction analysis
Step 1: Map the path into four moments
Write four lines for the page:
- See — can they tell what you offer and what to do next?
- Believe — is there enough proof before the ask?
- Start — can they begin without hunting or guessing?
- Finish — can they complete the form or checkout without getting stuck?
Friction hides in the gaps between those moments.
Step 2: Attach evidence to each moment
| Moment | What to look at | Friction signal |
|---|---|---|
| See | Bounce, five-second test, first screen on phone | People leave in seconds or can't say what you sell |
| Believe | Scroll to proof, recordings near the CTA | People scroll past the button looking for logos or reviews |
| Start | Scroll reach to CTA, click share on CTA | Few reach it, or many reach it and click something else |
| Finish | Form start vs submit, field-level drop-offs | Starts without submits, or a single field where people stop |
Use equal date ranges and split mobile from desktop. A combined view hides device-specific friction.
Step 3: Rank before you redesign
For each friction point, score roughly:
- How many visitors hit it (reach)
- How clearly it shows up in the data (confidence)
- How hard it is to fix (effort)
Fix high-reach, high-confidence, low-effort items first. Our CRO prioritization framework compares common scoring models if you want a fuller scorecard. Write the change as a one-line hypothesis before you ship it (CRO hypothesis template).
Step 4: Remove one friction point at a time
Change the biggest leak, leave the rest alone, and compare the same metric over equal windows. If you strip five fields and rewrite the hero in one deploy, you won't know what helped. On lower-traffic sites, our guide to CRO without A/B testing covers honest before-and-after measurement.
What reducing friction is not
- Not emptying the page. Cutting proof and price details can raise doubt, which is its own friction.
- Not copying a competitor's layout. Their traffic and offer aren't yours. Measure your path.
- Not a full redesign by default. Most friction is local: one field, one button, one missing line of copy.
- Not ignoring quality. A shorter form that fills the CRM with unqualified leads just moved the cost downstream.
A short friction checklist
- Promise on the page matches the ad or query
- Primary CTA visible on a real phone without scrolling
- Button label states the outcome; one primary style
- One piece of specific proof near the ask
- Form fields limited to what you need before follow-up
- Honest note about what happens after the click
- Mobile load and form tested on a real device
- Extra exits toned down on campaign landing pages
- Biggest leak written as a hypothesis with a metric
Where Cortality fits
Friction shows up as elements people skip, tap and abandon. Cortality measures how real visitors use every part of your page, including what they see, skip, tap and stop at, on each device. You get a ranked list of fixes, each with the evidence and the exact change to make, and after you ship a fix Cortality re-measures it and tells you whether it worked. It works alongside Google Analytics and Microsoft Clarity rather than replacing them. See how it works or what a finding looks like.
For a quick first look, our free page leak scan takes about a minute and needs no install. It's a prediction from our attention model, not data from your real visitors, so use it to decide where to look first.
Plans are $99, $249 or $499 a month (Starter, Growth and Scale). Start your free week, and you see your first report before you pay. You save a card at signup, and nothing is charged until 3 days after your first report. Cancel before then and you pay nothing, and any charge can be refunded within 14 days. How the free week works.
Questions
What is landing page friction?
Anything on the page or in the next step that adds effort, doubt or delay before a visitor converts: extra form fields, unclear calls to action, surprises about price or sales calls, slow loads, or steps that feel harder than the offer is worth.
How do I find friction on a landing page?
Split the path into see, understand, start and finish. Use scroll maps for reach, click maps for what people try, form analytics for where they quit, recordings for the why, and a short list of surprises you already know from sales or support. Rank by how many visitors hit each point and how hard it is to fix.
What's the difference between friction and a bad offer?
A bad offer fails even when the path is smooth: wrong audience, weak promise, price nobody wants. Friction is when people who match the offer still stall because the path is unclear, long or surprising. Fix targeting and promise first if traffic is wrong; fix friction when the right people arrive and still drop.
Should I remove every form field to reduce friction?
No. Remove fields you don't need before the first conversation, keep the ones you need to follow up well, and measure the result. Cutting a field that qualifies leads can raise submissions and lower quality. Treat each field as a cost you can justify or cut.