Case Study Page Heatmap: What B2B Buyers Look For Before They Book a Call
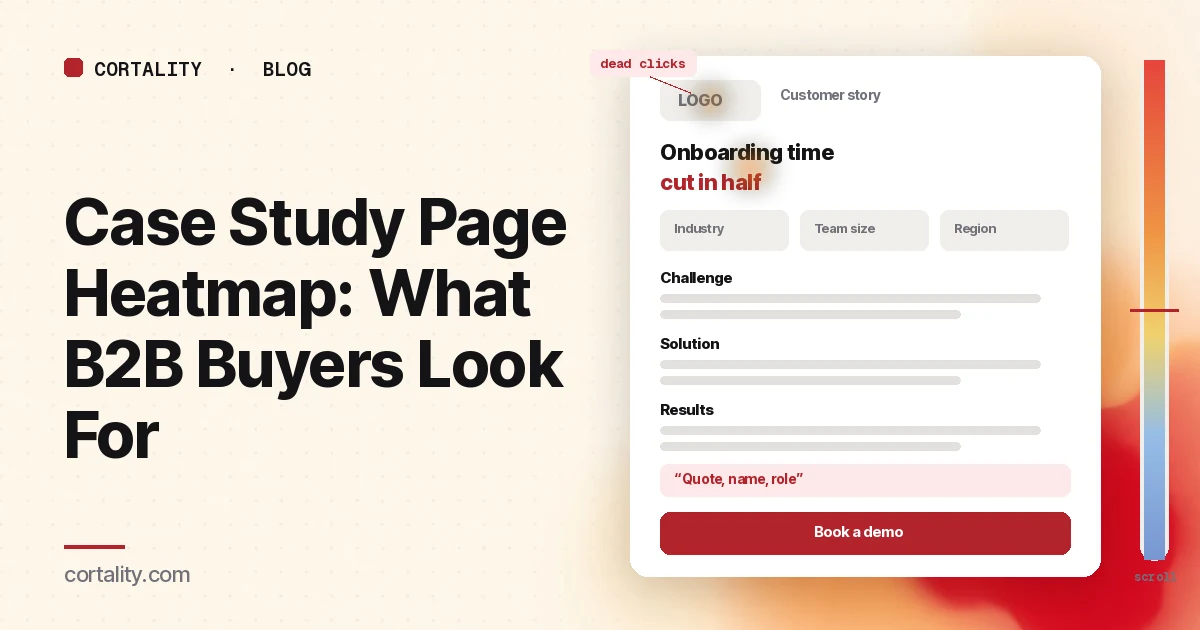
On a B2B site, the case study pages are where a serious buyer goes to check you. They have read the homepage and maybe the pricing page, and now they want to know one thing: did this work for a company like mine? The visitors on these pages are often further along than anyone else on the site. Some are about to book a call. Some are building a shortlist to send to a colleague.
Nielsen Norman Group's research on business-to-business sites makes the same point: B2B buyers go through long purchase cycles, and sites should provide content such as case studies that shows the problems you solve and how (Nielsen Norman Group, B2B vs. B2C Websites: Key UX Differences). Its earlier B2B testing also found that business users succeeded at their tasks on B2B sites only 58% of the time, against 66% on mainstream consumer sites (Nielsen Norman Group, B2B Usability, 2006). Proof that is hard to find is a common way to lose a buyer who was ready to talk.
This guide is about reading a heatmap of those pages: what to set up, what to look at first, what the common patterns usually mean, and which change to make first. It's part of our page-type series. For the page buyers often visit next, see the demo request page guide. For proof on the rest of the site, see trust signals before the first call to action and the about page heatmap. If you're new to heatmaps, how to read a website heatmap covers the basics first.
Why the case study page needs its own read
A case study is a story, but the buyer reads it like a checklist. Four questions decide whether it helps:
- Is this customer like me? Industry, size, the kind of team and the tools they use. A buyer skips a story about a company that doesn't look like theirs.
- What changed? The result, stated plainly, with the measure and the time it took. If the result is vague, the buyer assumes it was small.
- How did it work? What the customer actually did, how long setup took and who on their team was involved. This is where buyers judge the effort.
- What do I do next? Book a demo, see pricing, read another story from the same industry, or share the page with a colleague.
If any of those answers is missing or hard to find, the buyer either leaves or goes looking for it, and both show up on a heatmap. So read the page for the job it has: help a buyer who is already interested decide that you are worth a call.
What a case study page heatmap shows
A heatmap adds up clicks and scrolls from many visits onto one screenshot of the page. Microsoft Clarity, a free analytics tool, will draw one from any amount of traffic, for a single page or a group of pages (Microsoft Clarity, Heatmaps overview).
The click map ranks elements by clicks, including things that aren't links, and lets you switch to dead clicks, rage clicks, error clicks, first clicks and last clicks. From any element you can open the session recordings behind it (Microsoft Clarity, Click maps). On a case study, that tells you whether people click the customer's logo, the charts, the quote or the demo button, and where their last click lands before they leave.
The scroll map shows how far down the page people get, in 5% steps, with a drop-off view and the average fold (Microsoft Clarity, Scroll maps). Case studies are often long, so this is where you see how many visitors reach the results section at all.
The compare view puts two heatmaps side by side, for example mobile against desktop, or the page before and after you moved the result to the top (Microsoft Clarity, Heatmaps compare).
Set it up so the map means something
- Group the pages that share a template. Most sites have one case study layout. Read the group first for a stable map, then your most visited stories one by one.
- Split by device. Read mobile and desktop separately. B2B traffic leans to desktop on many sites, but buyers often first open a case study from an email or a link a colleague sent on a phone. Our guide to mobile vs desktop heatmaps explains why the maps differ.
- Know where people come from. A visitor from the case study index, from a sales email, from a paid ad and from search arrive with different questions. A buyer sent by your sales team already knows you; a search visitor may not know what you sell. If your analytics can filter by referrer or campaign, read the biggest group on its own.
- Write down the one action. On most case studies it's a click to book a demo or contact sales. On some it's a click to pricing or to the signup page. Pick one, and judge the map against it.
- Track the next step. Set the demo or contact form submission as a conversion in your analytics, and note how many case study sessions reach it. If people click the button but don't send the form, the problem is on the next page, not this one.
- Use a fixed window. Aim for a few hundred page views per device, and keep the window the same length when you compare before and after a change. Case study pages are often quiet, so a longer window is normal. If your traffic is low, heatmaps on a low-traffic website covers what you can still learn. Before you have data, our free page leak scan predicts where attention will land. It's a prediction, not your visitors' behavior, but it shows where to look first.
Read the first screen first
Expect most attention near the top. In Nielsen Norman Group's eyetracking research, people spent about 57% of their page-viewing time above the fold, about 74% in the first two screenfuls, and 81% in the first three (Nielsen Norman Group, Scrolling and Attention). On a case study, the first screen should answer two questions: who the customer is, and what changed.
Check that the result is on the first screen. A headline like "How a 40-person logistics team cut onboarding time in half" (illustrative) does more than "Acme Corp case study". If the first screen is a large hero photo and a company history, the result may sit below the average fold, and most visitors decide without it.
Check for a short context block. Industry, company size, region, the team that used the product and the time frame. Buyers look for these to decide whether the story applies to them. A small panel next to the headline answers it in a glance.
Check that the result is specific and true. State what was measured, over what period, and compared with what. If you can't share the exact number, describe the change honestly. A vague result reads as a weak one.
Then read the clicks
Dead clicks on the customer's logo are common. Visitors expect it to open the customer's site or more stories from that company. Either link it, or make it look clearly decorative.
Dead clicks on charts, screenshots or numbers usually mean people want to see more detail. If you have a larger version or a short explanation of how the number was measured, link it. If many people click a chart, it may also be the most convincing thing on the page, which is a hint to move it up.
Clicks on the quote are a good sign that people read it. Check that the quote names a person and a role. An anonymous quote is easy to skip.
First clicks on the menu, logo or the case study index from visitors who arrived from search often mean the page didn't show quickly enough that the story was relevant. Check where they go next. A visitor who opens another case study from the same industry got what they wanted; one who goes to the homepage may not know what you sell yet.
Clicks on "Book a demo" spread through the page are what you want. If nearly all of them come from the last button, after the full story, consider a button near the result as well, for buyers who are convinced early.
Clicks on "Download PDF" or "Share" show buyers passing the story to colleagues. That's useful, but a PDF ends your measurement. If many people download, make sure the PDF includes a link back and a clear next step.
Then read the scroll map
After the click ranking, spend a minute with the scroll map for each device.
Note the average fold and the share of visitors who reach the challenge, the solution, the results, the quote and the final call to action. On a long case study you would expect a steady drop. A sharp drop at one point usually means something there looks like the end of the page, or the section before it ran too long.
Watch for false floors: a full-width image, a big quote block or a strong color change that makes the page look finished. Nielsen Norman Group's scrolling research warns that a page that looks complete can stop people from scrolling. On a case study, the fix is usually to put the result and the key numbers above any such break, rather than to hope people scroll. Our scroll map analysis guide goes deeper on reading drop-off.
Use structure that skims. Nielsen Norman Group points to case studies laid out as Challenge, Solution and Results, in a bulleted format that buyers can check against other vendors (Nielsen Norman Group, B2B vs. B2C Websites). If the scroll map shows people skipping fast through long paragraphs, short labelled sections with bullets help them find the part they came for.
Then read the next step
The case study's job ends with a click to the next page. Read what happens after it.
Check the path to the demo page. If many case study visitors click "Book a demo" but few send the form, open the demo request page and its recordings. Long forms and unclear expectations about the call are common reasons. For field-by-field drop-off, our form abandonment analysis guide covers how to measure it.
Check the path to pricing. Buyers who go from a case study to pricing are checking whether the result is affordable for them. The pricing page heatmap guide covers what to look for there.
Check the related stories. If you show more case studies at the end, see whether people click them, and whether those are from the same industry. A related story from a different industry often gets few clicks.
Common mistakes reading a case study page heatmap
Judging it like a landing page. A case study is read by fewer people who are further along. A low click rate on the demo button can still be a good page if the visitors who do click are the right ones. Judge it against its own action and the leads it sends.
Reading the average of very different stories. A two-paragraph story and a two-thousand-word one don't behave the same. Read the group for the template, and the top stories on their own.
Fixing the page when the problem is the path. If few buyers reach the case studies at all, the issue may be that the homepage, the features page or the pricing page doesn't link to them. Check where proof is linked from across the site.
Changing everything at once. If you move the result up, add a context panel and add a second button in one go, you won't know which change helped.
Turn one pattern into one change
Pick one pattern, write down what you think it means, make one change, and re-measure over a window of the same length. For example (illustrative): "On desktop, fewer than half of case study visitors reach the results section, which sits after a long company history, and most of them leave without clicking the demo button. If we put a one-line result and a context panel at the top, and add a demo button next to the result, the share of case study sessions that click through to the demo page should rise over the next four weeks."
Our CRO hypothesis template gives you a format for writing these down. B2B traffic is often too low for a clean A/B test, so CRO without A/B testing shows how to measure a before-and-after honestly. If you run case studies for clients, proving CRO results to clients covers how to report the change. If you'd rather not run that re-measurement by hand, every Cortality plan re-measures each fix you ship; compare the plans.
Case study page heatmap checklist (copy this)
- Case study pages read as a group, then the top stories one by one
- Desktop and mobile read separately
- Main sources noted: index, sales emails, ads, search
- One action written down (demo, contact or pricing)
- Result and customer context on the first screen
- Result is specific, measured and true
- Dead clicks on logos, charts and numbers listed and fixed
- Quotes name a person and a role
- Challenge, solution and results in short labelled sections
- A next-step button near the result as well as at the end
- Demo form completion checked for case study visitors
- One change shipped, re-measured over the same window length
Where Cortality fits
Most of this comes down to one question: what do buyers actually see, skip and click on your case study pages, and do they go on to book a call? Cortality measures how real visitors use every part of your page, including the result line, the customer details, the quotes and the demo button, on each device. You get a ranked list of fixes, each with the evidence and the exact change to make, and after you ship a fix Cortality re-measures it and tells you whether it worked. It works alongside Google Analytics and Microsoft Clarity rather than replacing them. See how it works or what a finding looks like. For software companies, see Cortality for SaaS; for agencies, see Cortality for agencies.
For a quick first look, our free page leak scan takes about a minute and needs no install. It's a prediction from our attention model, not data from your real visitors, so use it to decide where to look first.
Plans are $99, $249 or $499 a month (Starter, Growth and Scale). Start your free week, and you see your first report before you pay. You save a card at signup, and nothing is charged until 3 days after your first report. Cancel before then and you pay nothing, and any charge can be refunded within 14 days. How the free week works.
Questions
What does a case study page heatmap show?
Where visitors click or tap on your case study pages, how far they scroll, and which elements they click that don't respond. On a case study that usually means whether people find the result, whether they look for details about the customer, whether they reach the quote and the numbers, and whether they click through to a demo, pricing or another case study, or leave.
Should I read one case study or all of them together?
Both. Read the case study pages as a group first, because most share a template and the group gives you enough traffic for a stable map. Then read your two or three most visited case studies one by one, since the result, the length and the customer differ, and a pattern on one page can disappear in the average.
What is the most common problem on case study pages?
The result is buried. Many case studies start with the customer's history and the challenge, and only state what changed near the end. On the scroll map, a large share of visitors never reach that part. Putting a one-line result and the customer's context at the top is usually the first change worth testing.
How much traffic does a case study page heatmap need?
A few hundred page views per device in the window you're reading is a sensible minimum. Microsoft Clarity will draw a heatmap from any amount of traffic, but a map from a few dozen visits mostly shows those few people. B2B case studies are often quiet, so group pages that share a template and read a longer window, alongside session recordings.
Where does Cortality fit on a case study page?
Cortality measures how real visitors use each part of your page, including the result line, the customer details, the quotes and the demo button, on each device. It ranks what to fix, and re-measures each change you ship. It works alongside Google Analytics and Microsoft Clarity rather than replacing them. Before the page has traffic, the free page leak scan at /leak/ is a prediction from our attention model, not data from your real visitors.