Blog Post Heatmap: How Far Readers Get and What They Click
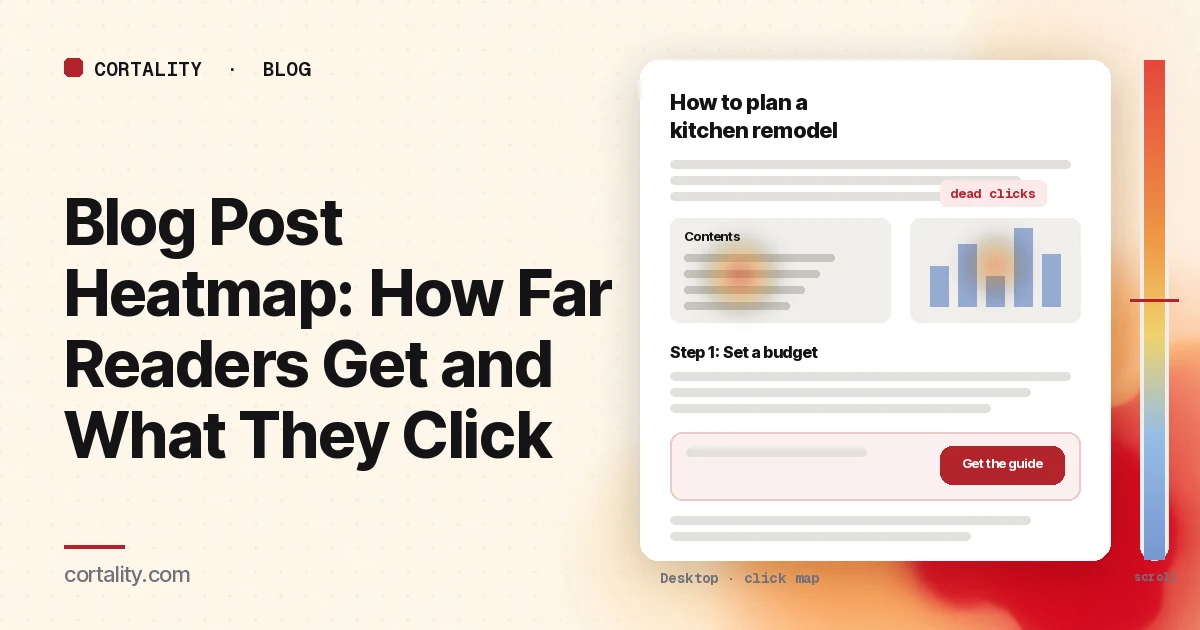
A blog post that ranks well can bring in more visitors than your homepage. Most of them arrive with a question, read some of the answer, and leave. Whether any of them take a next step, a product page, a free trial, a newsletter signup, depends on how far they read and what they see on the way. A blog post heatmap shows both.
This guide is about reading that data on articles and guides. If you're new to the map types, read how to read a scroll map and how to read a click map first. For where buttons should go on any page, see CTA button placement.
Decide what a good visit looks like
A product page has one obvious goal. A blog post has two, and they pull against each other:
- The reader gets their answer. That's why they came, and it's what search engines reward.
- Some readers take a next step. A click to a product page or a related guide, a signup, or a demo request.
Write down the next step for each post you plan to read. Every pattern below is judged against it. A post with heavy reading and no next-step clicks has a different problem from a post that readers leave after the first paragraph.
Set it up so the map means something
- Read the template and the top posts separately. The sidebar, header, newsletter box and end-of-post call to action are the same on every post, so group all posts to judge them. Microsoft Clarity lets you add several URL filters to view heatmaps for a group of pages (Microsoft Clarity, Scroll maps). Read your most visited posts one at a time to judge the writing and the order of sections.
- Split by where readers came from. Search visitors want a specific answer. Newsletter readers already know you. Social visitors are often skimming. Each reads differently. If one source is large, read it on its own.
- Split by device. On a phone the sidebar usually moves below the article or disappears, images shrink and the post gets much longer. Read each device separately. Our guide to mobile vs desktop heatmaps explains why the maps differ.
- Use a long enough, fixed window. Aim for a few hundred page views per device for each post you read, and keep the window the same length when you compare before and after a change. If your traffic is small, heatmaps on a low-traffic website covers what you can still read. For a new post with no traffic yet, our free page leak scan predicts where attention lands. It's a prediction, not your readers' behavior, but it shows where to look first.
- Know the page's states. Cookie banners, newsletter popups and sticky bars cover part of the article when they appear. Clarity notes that a page impression might not show the element a user clicked (Microsoft Clarity, Click maps). Write down which state your screenshot shows.
Read the scroll map first
On a long article, the scroll map tells you more than the click map. It shows the share of readers who reached each point and the average fold (Microsoft Clarity, Scroll maps). Note the share who reach:
- the end of the introduction
- your first in-article call to action or product mention
- the middle heading
- the end-of-post call to action
Expect most attention near the top. In Nielsen Norman Group's eyetracking research, people spent about 57% of their page-viewing time above the fold and about 74% in the first two screenfuls (NN/g, Scrolling and Attention). A gentle decline down a long post is normal. A sudden drop is worth a look.
This is also why GA4's scroll event isn't enough on its own. With enhanced measurement on, GA4 records a scroll event the first time a visitor reaches 90% of the page's height (Google Analytics Help, Enhanced measurement events). It tells you how many reached the bottom, not where the rest stopped.
7 blog post heatmap patterns, and what each usually means
The examples below are illustrative, to show what each pattern looks like. Your numbers will differ.
1. A steep drop right after the introduction
Readers took in the first screen and left. Often the introduction doesn't confirm that the answer is here: it warms up with background while the reader wanted the answer. Put a short, direct answer near the top, then explain. Check the post's search queries too. If the page ranks for a question it doesn't answer, the drop is a mismatch, not a writing problem.
2. A false floor below a large image or a full-width box
The scroll map falls off a cliff right below a wide image, a video, a big newsletter box or a band of whitespace. Readers took it for the end of the article. Nielsen Norman Group calls this the illusion of completeness (NN/g, The Illusion of Completeness). Make it clear more follows: shrink the gap, or let the next heading peek into view.
3. Your call to action sits below most readers
The end-of-post call to action is the one every blog template has, and on a long post it's often reached by a small share of readers. Compare its position on the scroll map with the share of readers who reach it. If most readers stop well before it, add one in-article call to action right after the section that answers the main question, where the reader has just seen why it matters. Keep it relevant to that post. A generic "Book a demo" on a how-to article usually gets ignored.
4. Heavy clicks on the table of contents
Clicks on the table of contents tell you which sections readers came for. If most of them jump to the fourth section, that's the answer readers wanted, and it's buried. Consider moving it up, or rewriting the introduction to answer it directly. Clicks on a section that doesn't exist yet are a topic for your next post.
5. Dead clicks on images, charts and screenshots
Readers tap a chart or a screenshot expecting a larger view. Clarity marks clicks that produce no response as dead clicks. Either make the image open full size, or make it large and readable enough not to need it, especially on phones. Our guide to rage clicks and dead clicks covers how to tell them apart.
6. Sidebar and banner calls to action get almost nothing
Readers focus on the article and ignore what sits beside it, especially anything that looks like an ad. Nielsen Norman Group found people ignore content that resembles ads or sits where ads usually appear, such as the right rail (NN/g, Banner Blindness Revisited). If the sidebar box gets few clicks, move the offer into the article as a plain sentence with a link, or a simple box styled like the content around it.
7. Many clicks on links that leave the site, few on yours
Check the click ranking for outbound links. Citations are good for readers and should stay. But if a source link early in the post is one of the most common last clicks, readers may be leaving to read the source instead of your post. Keep the citation, and move the point that needs it to after your own explanation. Then check whether the internal links to your related guides or product pages appear where readers are, and whether their text says where they go.
Common mistakes reading blog post heatmaps
- Reading all posts as one page for content questions. A group of posts tells you about the template. It can't tell you whether one article's introduction works.
- Judging the bottom of the post by its colors. Cold color at the end of a long post is expected. Judge each section by the share of readers who reached it and whether it needed to be seen.
- Counting time on page as reading. A tab left open counts too. Use the scroll map and clicks for evidence of reading.
- Chasing more clicks on everything. The goal is the reader's answer plus a next step. More clicks on outbound links or the logo aren't progress.
- Adding more calls to action instead of moving one. A post with five boxes asking for something reads like an ad, and readers tune all of them out.
Turn one pattern into one change
Pick the single pattern that affects the most readers on your highest-traffic post, and write it down as a hypothesis with a number you can re-check. For example (illustrative): "On mobile, search visitors to our most visited guide drop sharply after the second section, and the only call to action sits at the end. Add an in-article link to the related product page after the second section, and compare product page visits per post view over two equal weeks."
Our CRO hypothesis template gives you a format for writing these down. Blogs rarely get enough traffic on one post for a fast A/B test; CRO without A/B testing shows how to measure a before-and-after honestly. If you'd rather not run that re-measurement by hand, every Cortality plan re-measures each fix you ship; compare the plans. To find which elements on a page get skipped entirely, see which elements visitors ignore.
Blog post heatmap checklist (copy this)
- Next step written down for each post you read
- Template read on a group of all posts
- Top posts read one at a time
- Search, newsletter and social traffic read separately where large
- Desktop and mobile read separately
- A few hundred page views per device per post in the window
- Cookie banner, popup and sticky bar states noted before reading heat
- Scroll share recorded at the intro, first call to action, middle and end
- Introduction checked against the queries the post ranks for
- False floors checked below images, videos and full-width boxes
- Call to action position compared with where most readers stop
- Table of contents clicks used to rank sections by demand
- Dead clicks on images, charts and screenshots listed
- Sidebar and banner clicks compared with in-article link clicks
- Outbound links checked in the last-click map
- One change shipped, re-measured over the same window length
Where Cortality fits
Most of this comes down to one question: what do readers actually see, skip and click in your articles, and where do they stop? Cortality measures how real visitors use every part of your page, including the introduction, each section, the images and every call to action, on each device. You get a ranked list of fixes, each with the evidence and the exact change to make, and after you ship a fix Cortality re-measures it and tells you whether it worked. It works alongside Google Analytics and Microsoft Clarity rather than replacing them. See how it works or what a finding looks like.
For a quick first look, our free page leak scan takes about a minute and needs no install. It's a prediction from our attention model, not data from your real visitors, so use it to decide where to look first.
Plans are $99, $249 or $499 a month (Starter, Growth and Scale). Start your free week, and you see your first report before you pay. You save a card at signup, and nothing is charged until 3 days after your first report. Cancel before then and you pay nothing, and any charge can be refunded within 14 days. How the free week works.
Questions
What does a blog post heatmap show?
How far down an article readers scroll, which parts they click or tap, and which elements they click that aren't links. It shows whether readers reach your call to action, which sections they jump to from the table of contents, and where they leave for another page or another site.
Isn't GA4's scroll event enough to measure blog scroll depth?
It's a start, but it only tells you one thing. With enhanced measurement on, GA4 records a scroll event the first time a visitor reaches 90% of the page's height. A scroll map shows the share of readers at every point in the article, so you can see where they stop and whether that's above or below your call to action.
Should I read each blog post separately or all together?
Both. Read all posts as one group to judge what every post shares: the template, the sidebar, the newsletter box and the end-of-post call to action. Read your most visited posts one at a time to judge the writing, the order of sections and where the call to action sits in that article.
How much traffic does a blog post heatmap need?
A few hundred page views per device in the window is a sensible minimum for one post. Most blogs have a few posts that get most of the traffic, so start with those, and group the rest by template.