Returns Policy Page Heatmap: What Holiday Shoppers Look For Before They Buy
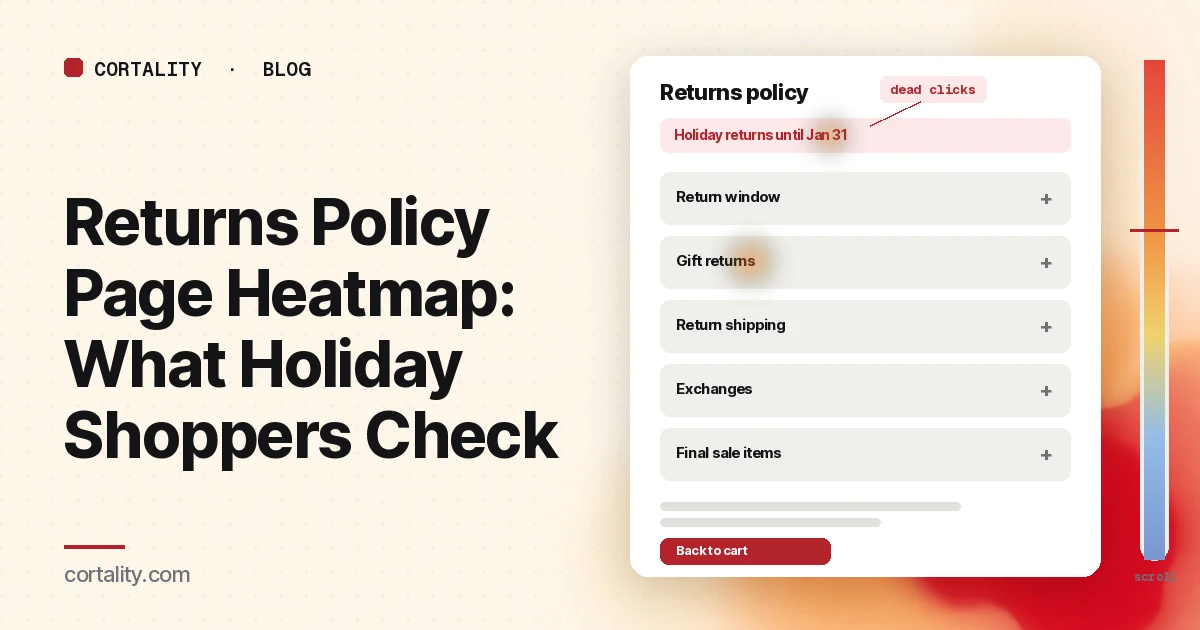
Most stores treat the returns policy page as a legal page: written once, linked from the footer, and never looked at again. In the holiday season it does a different job. Gift buyers open it before they buy, to find out whether the person they're buying for can send the item back, until when, and who pays for it. If the page answers that quickly, they go back to the product. If it doesn't, some of them never come back.
Returns are a large part of the season. In the National Retail Federation and Happy Returns' 2025 report, retailers expected 17% of holiday sales to be returned, and estimated that 19.3% of all online sales would come back over the year. In the same survey, 82% of consumers cited free returns as a major consideration when making a purchase, and 37% of retailers planned to extend return windows to manage holiday returns (NRF, 2025 Retail Returns Landscape, Oct. 15, 2025). Your returns page is where shoppers find out which of those policies you chose.
This guide is about reading a heatmap of that page: what to set up, what to look at first, what the common patterns usually mean, and which change to make first. It's part of our page-type series. For when and where to show delivery deadlines, see holiday shipping cutoff dates. For the gift guide that often sends shoppers here, see the gift guide page heatmap. For the rest of the store in the holiday window, use the holiday ecommerce CRO checklist. If you're new to heatmaps, how to read a website heatmap covers the basics first.
Why the returns page matters more in the holiday window
In Baymard's research, 42% of U.S. online shoppers had abandoned a cart because they were just browsing. Among the remaining reasons, 40% pointed to extra costs (shipping, tax, fees), 20% to delivery that was too slow, and 13% to an unsatisfactory returns policy (Baymard Institute, Cart abandonment rate, updated Oct. 28, 2026). That 13% is a year-round figure. In December, three things make the returns question sharper:
- The buyer isn't the user. A gift buyer can't check the fit, the color or the taste of the person receiving it. The returns policy is their insurance, and they read it on behalf of someone else.
- The calendar is odd. A standard 30-day window that starts at purchase can run out before a gift bought in mid-November is even opened. Many stores extend the window for holiday purchases. Shoppers need to see whether you do, and until when.
- Gift returns are different from normal returns. The recipient often has no order number, may want an exchange or store credit rather than a refund to the buyer's card, and may not want the buyer to see the price. If your page doesn't mention gift returns at all, a careful buyer has to guess.
So read the page for the job it has in the season: let a nervous gift buyer confirm, in a few seconds, that the purchase is safe, then get back to the product.
What a returns policy page heatmap shows
A heatmap adds up clicks and scrolls from many visits onto one screenshot of the page. Microsoft Clarity, a free analytics tool, will draw one from any amount of traffic, for a single page or a group of pages (Microsoft Clarity, Heatmaps overview).
The click map ranks elements by clicks, including things that aren't links, and lets you switch to dead clicks, rage clicks, error clicks, first clicks and last clicks. From any element you can open the session recordings behind it (Microsoft Clarity, Click maps). On a returns page, that tells you which sections people open, which dates and bold lines they tap in vain, and where their last click happens before they leave.
The scroll map shows how far down the page people get, in 5% steps, with a drop-off view and the average fold (Microsoft Clarity, Scroll maps). Returns pages are often long blocks of text, and the line a gift buyer needs can sit far below where most of them stop.
The compare view puts two heatmaps side by side, for example mobile against desktop, or the page before and after you moved the holiday window to the top (Microsoft Clarity, Heatmaps compare).
Set it up so the map means something
- Separate shoppers from customers making a return. The same page serves two groups. Shoppers arrive from a product page, the cart, a gift guide or the footer, usually in a session with no order yet. Customers arrive from an order email or their account to start a return. Their clicks mean different things. In Google Analytics 4, a path exploration that starts from the returns page or ends on it shows which pages lead there and where people go next (Google Analytics, Path exploration). Use that to see how much of your returns traffic is pre-purchase, and filter recordings the same way if your tools allow it.
- Split by device. Read mobile and desktop separately. Accordions, tables of return windows and long legal paragraphs behave very differently on a phone. Our guide to mobile vs desktop heatmaps explains why the maps differ.
- Find every way in. Note where the page is linked: footer, product page, cart, checkout, gift guide, order emails. If a product page opens the policy in a drawer or popup instead of a page, that drawer has its own clicks to read.
- Know the page's states. Accordions, tabs ("Returns," "Exchanges," "Gift returns"), and a holiday banner at the top all change what people see. Clarity notes that the page impression shown on a click map might not show the element a user actually clicked. Write down which state you're looking at, and open recordings when the screenshot and the ranking disagree.
- Write down the one action. For shoppers, the action is going back: to the product, the cart or the gift guide. For customers, it's starting a return or an exchange. Judge each group's map against its own action.
- Use a fixed, long enough window. Aim for a few hundred page views per device, and keep the window the same length when you compare before and after a change. Returns pages are often quiet; if yours is, heatmaps on a low-traffic website covers what you can still learn. Before you have data, our free page leak scan predicts where attention will land. It's a prediction, not your visitors' behavior, but it shows where to look first.
Read the first screen first
Expect most attention near the top. In Nielsen Norman Group's eyetracking research, people spent about 57% of their page-viewing time above the fold, about 74% in the first two screenfuls, and 81% in the first three (Nielsen Norman Group, Scrolling and Attention). For a gift buyer, the first screen of the returns page should answer three questions: how long, for gifts too, and who pays.
Check that the return window is on the first screen. If the page opens with a paragraph about your commitment to customers, or a long list of exclusions, the actual window ("30 days from delivery," or your holiday dates) may sit below the average fold on a phone. A low share of visitors reaching it then means they never saw the answer.
Check that the holiday window, if you have one, is said plainly. "Extended holiday returns" with no dates is a promise shoppers can't check. If you extend the window, state which purchase dates it covers and the last day to return, in one line, near the top. Then make sure the product page, cart and order confirmation say the same thing.
Check for a gift returns line. If your policy covers gift returns, gift receipts or exchanges for recipients, a short line on the first screen is enough: what the recipient needs, and what they get back. If your policy doesn't cover them, the heatmap will often show people hunting for it, scrolling the whole page or searching.
Then read the clicks below the first screen
Dead clicks on dates, bold text and words like "free" or "exchange" mean people expected a link or more detail. A bold "free returns" with an asterisk that goes nowhere is a common one. Either explain it right there, or link to the explanation.
Rage clicks on accordion headers on mobile often point to a slow or broken accordion, or a tap target too small to hit. Watch two or three of those recordings before you change anything.
Clicks on "Start a return" from shoppers who have no order are a sign the page reads like a returns portal rather than a policy. That's fine for customers, but a shopper scanning for the window can mistake it for the main content. Keep the policy answer above the portal button, or give each its own clear heading.
Last clicks on the exclusions list ("final sale," "personalized items," "opened electronics") show where people are checking whether their item is covered. If many last clicks land there and the session ends, the exclusions may be broad, or written in a way that sounds broader than they are. Name the excluded categories plainly, and say on the product page itself if an item is final sale.
First clicks on the menu, logo or search from shoppers who came from a product page mean they gave up on the page quickly. Check what they search for next. The site search heatmap guide covers how to read those queries; a search for "gift receipt" or "exchange" is a strong hint about a missing line.
Then read the path back to shopping
For a shopper, a good visit to the returns page is a short one that ends back on the product or in the cart.
Look at where shoppers go next. In the path exploration, compare the share of shoppers who return to a product page or the cart with the share who leave the site. If most leave, the page isn't reassuring them, or it's a dead end with no way back.
Check for a way back. A policy page with no link back to the cart or the product means the shopper has to use the browser's Back button, or the menu. On mobile, a drawer that opens over the product page is often better than a separate page for exactly this reason, as long as it closes cleanly.
Read the product page and cart from the other side. On the product page heatmap, check clicks on the returns link or line near the add-to-cart button. On the cart page heatmap, check last clicks on the returns link before an exit. If shoppers click the returns link from the cart and don't come back, the returns page may be costing you orders that were almost done.
Then read the scroll map
After the click ranking, spend a minute with the mobile scroll map.
Note the average fold and the share of visitors who reach the return window, the gift returns section, the return shipping cost and the exclusions. On a long policy page, a section near the bottom often gets a small share of visitors. That matters when it's the section shoppers came for. If the return shipping cost sits at 80% of the page and only a small share of visitors get that far, move it up, or summarize it in the first screen.
Watch for false floors: a full-width banner, a contact block, or a strong color change that makes the page look finished. Nielsen Norman Group's research on scrolling warns that a page that looks complete can stop people from scrolling. A short summary at the top, with anchor links to each section, helps more than hoping people scroll.
Common mistakes reading a returns page heatmap
Mixing shoppers and customers. A map where most clicks land on "Start a return" may just mean most visitors were customers with an order. Read the pre-purchase group on its own before you change anything for shoppers.
Reading only the page, not the links to it. If the product page and cart describe the policy differently from the returns page, the page will look confusing in recordings for reasons the map can't show. Check that every place you mention returns uses the same window and the same words.
Using the heatmap to decide the policy. A heatmap can show that shoppers look for a longer window or free return shipping. It can't tell you whether you can afford to offer them. That's a business decision. The map is for making the policy you have easy to find and understand.
Ignoring the date. The same page behaves differently in mid-November, in the week before your last order-by date, and in January when gifts come back. Don't compare a quiet window with a busy one and call the difference a result of your change. The Black Friday post-mortem guide covers how to compare holiday periods fairly.
Changing everything at once. If you rewrite the policy, reorder the sections and add a summary in one go, you won't know which change helped.
Turn one pattern into one change
Pick one pattern, write down what you think it means, make one change, and re-measure over a window of the same length. For example: "On mobile, shoppers who reach the returns page from the cart rarely reach the holiday return dates, which sit below the exclusions, and most of them leave the site. If we put the holiday window and the gift returns line in a short summary at the top, the share of those shoppers who go back to the cart should rise over the next seven days."
Our CRO hypothesis template gives you a format for writing these down. With holiday traffic changing day to day, a clean A/B test is often out of reach, so CRO without A/B testing shows how to measure a before-and-after honestly. If you'd rather not run that re-measurement by hand, every Cortality plan re-measures each fix you ship; compare the plans.
Returns policy page heatmap checklist (copy this)
- Shoppers (from product page, cart, gift guide, footer) separated from customers starting a return
- Desktop and mobile read separately
- Every link to the page listed, including drawers and order emails
- Page states noted: accordions, tabs, holiday banner
- One action written down for each group (back to shopping, or start a return)
- Return window on the first screen on a phone
- Holiday window, if any, stated with purchase dates and a last return date
- Gift returns, gift receipts and exchanges explained in one line near the top
- Dead clicks on dates, bold lines and "free" claims listed and fixed
- Exclusions named plainly, and final-sale items marked on the product page
- A clear way back to the cart or product
- Product page, cart and order confirmation use the same window and wording
- Mobile scroll map checked for the window, gift returns, return shipping cost and exclusions
- One change shipped, re-measured over the same window length
Where Cortality fits
Most of this comes down to one question: what do holiday shoppers actually see, skip and tap on your returns page, and do they go back to the cart or leave? Cortality measures how real visitors use every part of your page, including the return window, the gift returns section and the links back to shopping, on each device. You get a ranked list of fixes, each with the evidence and the exact change to make, and after you ship a fix Cortality re-measures it and tells you whether it worked. It works alongside Google Analytics and Microsoft Clarity rather than replacing them. See how it works or what a finding looks like. For online stores, see Cortality for Shopify stores.
For a quick first look, our free page leak scan takes about a minute and needs no install. It's a prediction from our attention model, not data from your real visitors, so use it to decide where to look first.
Plans are $99, $249 or $499 a month (Starter, Growth and Scale). Start your free week, and you see your first report before you pay. You save a card at signup, and nothing is charged until 3 days after your first report. Cancel before then and you pay nothing, and any charge can be refunded within 14 days. How the free week works.
Questions
What does a returns policy page heatmap show?
Where visitors click or tap on your returns or refund policy page, how far they scroll, and which elements they click that don't respond. On a returns page that usually means whether people open the gift returns or holiday window section, whether they tap dates or bold lines that aren't links, whether they reach the return shipping cost, and whether they go back to shopping or leave.
Why would a shopper read the returns policy before buying?
To check the risk of the purchase. Gift buyers in particular want to know whether the recipient can return or exchange the item, until when, and who pays for return shipping. If the page doesn't answer those questions quickly, some shoppers stop there. In Baymard's survey, 13% of U.S. online shoppers who had abandoned a cart for a reason other than browsing pointed to an unsatisfactory returns policy.
How do I separate shoppers from customers starting a return?
Use where the visit came from. Shoppers usually reach the returns page from a product page, the cart or the footer in a session without an order. Customers starting a return usually come from an order email or their account. If your analytics can filter by previous page or by sessions with and without a purchase, read the two groups separately; their clicks mean different things.
How much traffic does a returns policy page heatmap need?
A few hundred page views per device in the window you're reading is a sensible minimum. Microsoft Clarity will draw a heatmap from any amount of traffic, but a map from a few dozen visits mostly shows those few people. Returns pages are often quiet, so read a longer window and lean on session recordings from shoppers who reached the page from a product page or the cart.
Where does Cortality fit on a returns policy page?
Cortality measures how real visitors use each part of your page, including the return window, the gift returns section and the links back to shopping, on each device. It ranks what to fix, and re-measures each change you ship. It works alongside Google Analytics and Microsoft Clarity rather than replacing them. Before the page has traffic, the free page leak scan at /leak/ is a prediction from our attention model, not data from your real visitors.