Black Friday Post-Mortem: How to Review What Happened on Your Store's Sale Weekend
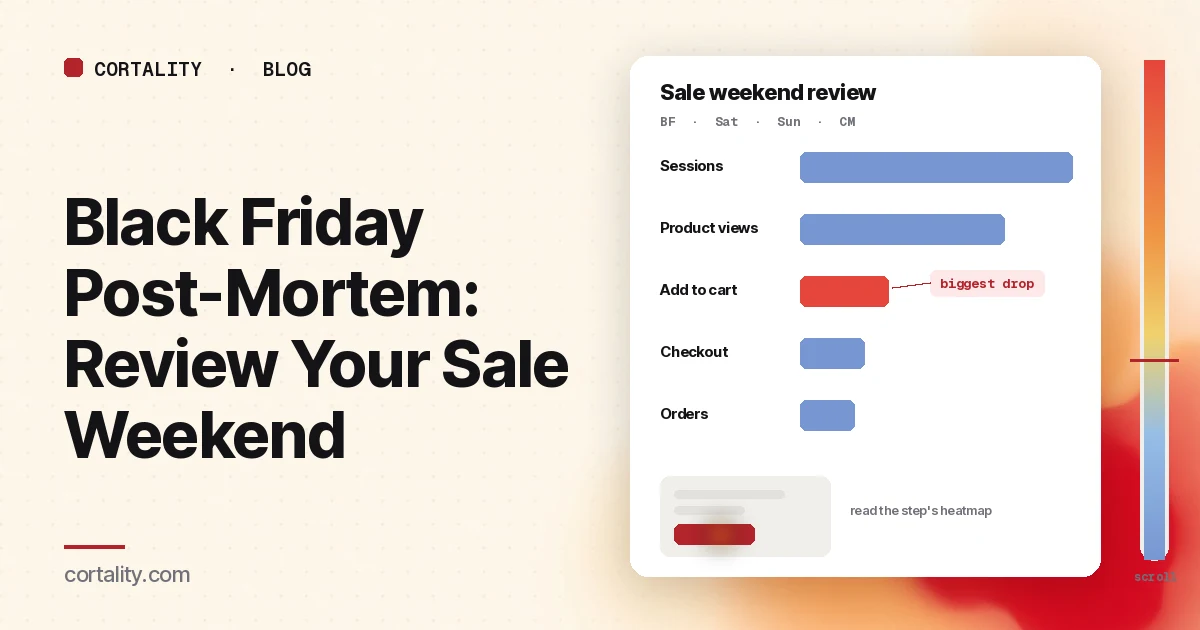
Black Friday and Cyber Monday end the way they start: in a rush. By Tuesday, most teams have a revenue number, a feeling about whether it was good, and a list of things that broke. A post-mortem turns that into something you can use: a fair comparison, the one step in the funnel that lost the most shoppers, what visitors actually did on those pages, and a short list of changes.
It is worth doing properly because the weekend is a large share of the season. Adobe forecasts that Cyber Week, the five days from Thanksgiving through Cyber Monday, will drive $47.5 billion in U.S. online spending this year, 17.3% of the Nov. 1 to Dec. 31 season. It expects $15.1 billion on Cyber Monday, Nov. 30, and $12.9 billion on Black Friday (Adobe, 2026 holiday forecast, Sept. 28, 2026). And the season doesn't end on Monday. The December gift weeks still lie ahead, so what you learn on Tuesday can still be used this year.
This guide walks through that review step by step. It assumes the sale is over. If it hasn't started yet, read the holiday ecommerce CRO checklist and the Black Friday landing page heatmap guide first, and set up the measurement they describe, so this review has data to work with.
Before you start: write it down while it's fresh
During the weekend, keep a running note. Anything you'll otherwise forget by Tuesday goes in it:
- Times when the site was slow, an app failed, or checkout threw errors
- Discount codes that didn't apply, or applied twice
- Products that sold out, and when
- Emails, ads or posts that went out, with the time sent
- Customer service questions that came up again and again
- Any change you made to the site in the middle of the sale
That last one matters most. If you changed the homepage banner on Saturday morning, any before-and-after inside the weekend is mixed up with the change. The log is what lets you tell the calendar apart from your own edits later.
Step 1: Compare the weekend fairly
Sale-weekend shoppers arrive with more intent and bigger discounts than usual. Adobe expects discounts of up to 30% off listed price during Cyber Week this year, against up to 14% in early November. Comparing Black Friday with an ordinary week mostly tells you that Black Friday is Black Friday.
Use two comparisons instead:
- This year's sale days against last year's sale days, matched by event, not by date. Thanksgiving fell on Nov. 27 last year and falls on Nov. 26 this year. Cyber Monday was Dec. 1, 2025 and is Nov. 30, 2026. Compare Thanksgiving with Thanksgiving, Black Friday with Black Friday, and so on, or the numbers will be off by a day of the busiest week of the year.
- The sale days against the two or three weeks before the sale. That shows how much the event lifted each step of the funnel against your own recent baseline, and it's your only baseline if you didn't track last year.
In Google Analytics 4, you can put both side by side with comparisons, which show subsets of your data next to each other based on dimensions you choose, such as device category or session source (Google Analytics, Apply comparisons to reports), together with a compared date range.
Before you read anything, check what changed between the two periods besides the site: a different discount depth, a new paid channel, a bigger email list, a different set of products on sale. Write those down next to the comparison. They are often the real explanation.
Step 2: Split before you judge
A blended conversion rate hides most of what happened. Split the weekend at least three ways:
- By device. Adobe expects 57.4% of this season's online spending to happen on phones, and 63% on Thanksgiving Day. If mobile conversion fell while desktop held steady, the problem is likely on the mobile version of a page, not in the offer.
- By source. Email to past customers, paid social, paid search, affiliates and organic search bring different people with different expectations. One weak source can drag the whole weekend down. Adobe also expects traffic to U.S. retail sites from AI chat and browser tools to rise 130% this season, so if that source shows up in your referral reports, read it on its own rather than letting it blur into "other."
- By landing page. The sale landing page, the homepage, a gift guide (see the gift guide page heatmap guide) and individual product pages from ads will each have their own story.
You're looking for the segment where the gap between this year and your baseline is largest. That segment gets the rest of the review.
Step 3: Find the step that lost the most shoppers
Within that segment, lay out the funnel. Google Analytics 4 has recommended ecommerce events for each step, including view_item, add_to_cart, view_cart, begin_checkout and purchase (Google Analytics, Measure ecommerce). If your store sends them, you can count how many sessions reached each step.
Then compare the step-to-step rates with your baselines, not just the final conversion rate:
| Where the drop is | What it usually points to |
|---|---|
| Landing to product view | The offer, the first screen, or the path into products |
| Product view to add to cart | Price, stock, delivery and gift details, or the add-to-cart control on mobile |
| Cart to checkout | Unexpected costs, the order-by date, or a discount field that distracts |
| Checkout to purchase | Forms, payment methods, errors, or forced account creation |
The step whose rate fell furthest below its baseline is where to look first. A small drop at a step that handles most of your traffic can matter more than a large drop at a step few people reach, so look at the number of shoppers lost as well as the percentage.
For the later steps, Baymard's research gives a useful frame for why shoppers leave. In its survey, 42% of U.S. online shoppers had abandoned a cart because they were just browsing. Among the rest, 40% pointed to extra costs (shipping, tax, fees), 20% to delivery that was too slow, 18% to being asked to create an account, 17% to a checkout that was too long or complicated, and 12% to not being able to see or calculate the total cost up front (Baymard Institute, Cart abandonment rate, updated Oct. 28, 2026). Use that list as a set of questions to check against your own pages, not as an answer.
Step 4: Read what visitors did on that step
Numbers tell you where shoppers left. Heatmaps and session recordings tell you what they were doing just before.
Open the pages for the step you picked, filtered to the segment and the sale days. Microsoft Clarity will draw a heatmap for a single page or a group of pages, from any amount of traffic (Microsoft Clarity, Heatmaps overview). Its click maps rank elements by clicks and let you switch to dead, rage, error, first and last clicks (Microsoft Clarity, Click maps). Its compare view puts two heatmaps side by side, which is useful for the sale days against the weeks before, or mobile against desktop (Microsoft Clarity, Heatmaps compare).
What to look for, by step:
- Landing pages: whether the shop button sat above the average fold on a phone, whether first clicks went into the offer or out through the menu, and dead clicks on countdowns and sale badges. The Black Friday landing page heatmap guide covers these patterns.
- Product pages: clicks on size charts, delivery estimates and "notify me" buttons, rage clicks on variant pickers, and whether add to cart was reachable without scrolling on mobile. See the product page heatmap guide.
- Cart: clicks on shipping estimates and discount fields, and last clicks before people left. See the cart page heatmap guide.
- Checkout: error clicks, rage clicks on payment buttons, and fields where people stalled. See the checkout page heatmap guide.
Then watch recordings. Pick ten or so sessions from the segment that reached the step and left. Watch for repeats: the same error, the same hunt for a shipping date, the same tap on something that doesn't respond. Three or four sessions with the same problem are more useful than a long list of one-off oddities.
Remember what a sale-day heatmap is: a picture of an unusual crowd on a page that may have changed several times over the weekend. Check your log of changes and sold-out products before you read anything into one screenshot. Clarity notes that a heatmap's page impression may not show the element a user actually clicked, so when the picture and the ranking disagree, trust the recordings.
Step 5: Separate the three kinds of problems
By now you'll have a list. Sort it into three groups, because each one needs a different response:
- Things that broke. Errors, discount codes that failed, a slow app, a checkout bug on one browser. These are not conversion experiments. Fix them, and add a test for them to next year's pre-sale rehearsal.
- Things about the offer or the stock. The discount was shallower than competitors', the hero product sold out on Friday, the free shipping threshold was too high. These are business decisions. Write them down for whoever plans next year's sale.
- Things about the pages. The button below the fold on mobile, the delivery date only in the cart, the dead clicks on product images. These are the ones heatmaps and recordings are best at finding, and the ones you can often change this week.
Most post-mortems blur these together and end with "improve the checkout." Sorting them makes the next step obvious.
Step 6: Pick a few changes, and decide when to make them
You will not fix everything. Choose a small number of page changes, ranked by how many shoppers the problem plausibly cost and how easy it is to change. Our CRO prioritization framework gives a simple way to score them.
Then decide on timing:
- Before the December gift weeks: anything broken, anything about delivery dates and gift details, and any page problem that will affect gift shoppers. Your last order-by date is the real deadline; our holiday shipping cutoff dates guide covers how to set it.
- In January: larger layout changes, new templates, and anything you'd like to measure carefully. Traffic is steadier then, and a before-and-after is easier to read.
- Next year's sale plan: the offer and stock lessons, and a pre-sale rehearsal list built from what broke.
For each page change, write a hypothesis, make one change at a time, and re-measure over a window of the same length. The CRO hypothesis template gives you a format, and CRO without A/B testing shows how to measure a before-and-after honestly when holiday traffic makes a proper test hard. If you'd rather not run that re-measurement by hand, every Cortality plan re-measures each fix you ship; compare the plans.
Common post-mortem mistakes
Judging changes made during the weekend. Traffic shifts hour by hour from Thanksgiving through Cyber Monday. A before-and-after inside those days mostly measures the calendar.
Comparing by date instead of by event. With Thanksgiving a day earlier this year, Nov. 27 is Black Friday in 2026 but was Thanksgiving in 2025.
Reading only the total. A flat overall conversion rate can hide a mobile problem that desktop made up for, or one bad landing page dragging down a good weekend.
Blaming the page for an offer problem. If shoppers reached the product, saw the price, and left, the page may have done its job.
Ending with a list nobody owns. A post-mortem that ends without dates and owners is a document, not a plan.
Black Friday post-mortem checklist (copy this)
- Weekend log written: outages, errors, failed codes, sold-out products, sends, mid-sale changes
- Sale days compared with last year's sale days, matched by event, not by date
- Sale days compared with the two or three weeks before the sale
- Other changes noted: discount depth, channels, list size, products on sale
- Results split by device, source and landing page; weakest segment chosen
- Funnel laid out for that segment: product view, add to cart, cart, checkout, purchase
- Step with the largest drop against baseline chosen, by shoppers lost as well as percentage
- Heatmaps for that step read for the segment and the sale days, compared with the weeks before
- Ten or so recordings watched; repeated problems listed
- Problems sorted: broken, offer or stock, pages
- A few page changes ranked and given an owner and a date: before December or January
- Offer and stock lessons and a rehearsal list saved for next year
- Each change shipped one at a time and re-measured over the same window length
Where Cortality fits
Most of this review comes down to one question: what did visitors actually see, skip and tap on your pages, and where did they give up? Cortality measures how real visitors use every part of your page, on each device. You get a ranked list of fixes, each with the evidence and the exact change to make, and after you ship a fix Cortality re-measures it and tells you whether it worked. It works alongside Google Analytics and Microsoft Clarity rather than replacing them. See how it works or what a finding looks like. For online stores, see Cortality for Shopify stores.
For a quick first look at the page your post-mortem points to, our free page leak scan takes about a minute and needs no install. It's a prediction from our attention model, not data from your real visitors, so use it to decide where to look first.
Plans are $99, $249 or $499 a month (Starter, Growth and Scale). Start your free week, and you see your first report before you pay. You save a card at signup, and nothing is charged until 3 days after your first report. Cancel before then and you pay nothing, and any charge can be refunded within 14 days. How the free week works.
Questions
What is a Black Friday post-mortem?
A short, structured review of your store's Black Friday and Cyber Monday weekend once it is over. You compare the weekend fairly with last year, find the funnel step that lost the most shoppers, look at what visitors did on the pages at that step, and write down a small number of changes to make, some before the December gift rush and some for next year.
When should I run the post-mortem?
Write down what went wrong during the weekend while it is fresh, then run the full review in the first few days after Cyber Monday, once orders, refunds and late reports have settled. That leaves time to fix anything urgent before December gift traffic and the last shipping dates.
Should I compare Black Friday with a normal week?
Not on its own. Sale-weekend shoppers arrive with more intent and bigger discounts, so almost any metric looks different from a normal week. Compare this year's sale days with last year's equivalent days, Black Friday with Black Friday, and use the weeks just before the sale as a second reference point.
What if I don't have last year's data?
Use the two or three weeks before the sale as your baseline, and compare each step of the funnel rather than the overall conversion rate. You can still find the step that lost the most shoppers, and heatmaps and session recordings from the weekend will show what happened on those pages.
What is a post-Black Friday heatmap audit?
The page-level part of a Black Friday post-mortem. After you find the funnel step that lost the most shoppers, you open the pages at that step, filtered to the sale days, and read heatmaps and session recordings to see what people were doing just before they left. Check your log of changes and sold-out products first, because a sale-day map is a picture of an unusual crowd on a page that may have changed over the weekend.
What should I look for in a post-Black Friday heatmap audit?
It depends on the step. On landing pages: whether the shop button sat above the average fold on a phone, whether first clicks went into the offer or out through the menu, and dead clicks on countdowns and sale badges. On product pages: clicks on size charts, delivery estimates and notify-me buttons, and whether add to cart was reachable without scrolling on mobile. On the cart: shipping estimates and discount fields. On checkout: error clicks, rage clicks on payment buttons and fields where people stalled. Then watch recordings from people who reached the step and left, and look for the same problem repeating.