Holiday Popup Heatmap: How to Tell Whether Your Sale Popup Helps or Gets in the Way
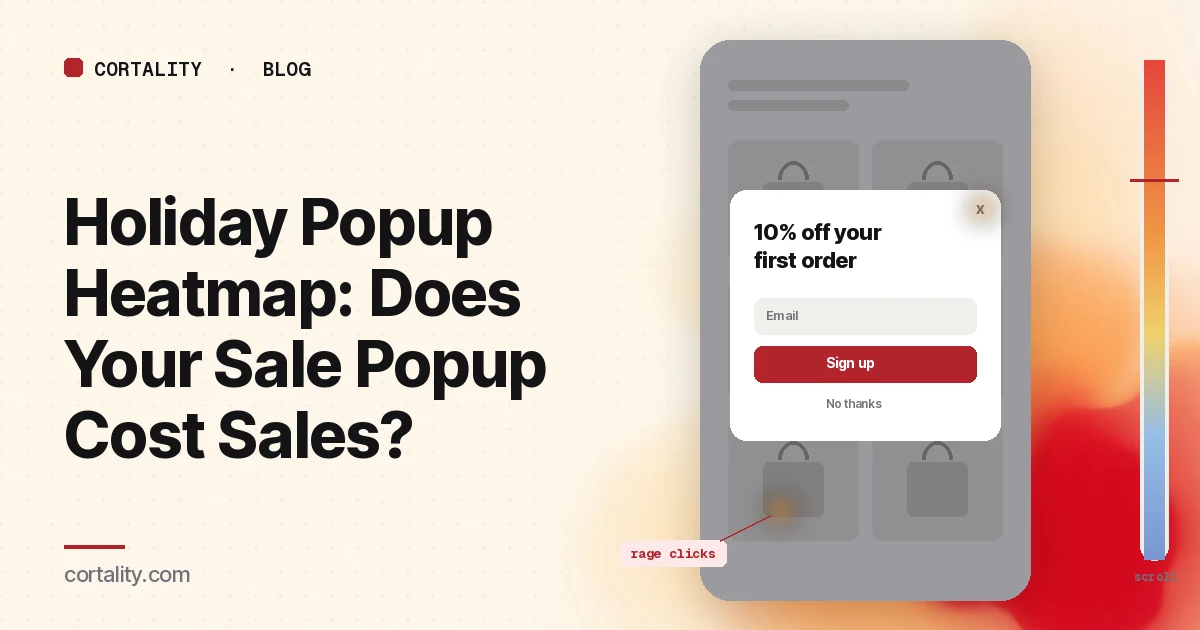
In the holiday season, almost every store adds something on top of the page. An email popup with a discount, a spin-to-win wheel, an "early access" sign-up, a free-shipping bar, a cookie banner, a chat bubble. Each one makes sense on its own. Together, on a phone, they can cover the sale page your ads paid to show.
Most of that traffic will be on phones. Adobe forecasts that mobile will account for 57.4% of U.S. holiday online spending this season, and 63% on Thanksgiving Day (Adobe, 2026 holiday forecast, Sept. 28, 2026). A popup that takes a third of a laptop screen can take all of a phone screen.
This guide is about reading heatmaps and session recordings of a holiday popup: what a heatmap can and can't show about an overlay, how to set it up, what the common patterns usually mean, and which change to make first. It's not an argument for or against popups. It's a way to find out what yours is doing. For the sale page underneath, see the Black Friday landing page heatmap. For the rest of the store in the holiday window, use the holiday ecommerce CRO checklist. If you're new to heatmaps, how to read a website heatmap covers the basics first.
Why a sale popup needs its own read
A popup's own report usually shows one number: how many visitors signed up. That's half the picture. The other half is what happened to the visitors who didn't, and on a sale page that is most of them.
Three things make holiday popups worth a closer look:
- The traffic is expensive and impatient. Paid social, search and email visitors arrive expecting the offer they clicked on. A popup that covers it, before they've seen anything, asks for something before giving anything. Nielsen Norman Group lists showing a popup before people can get any value from the page as the first of its ten problematic popup trends (Nielsen Norman Group, Popups: 10 Problematic Trends and Alternatives).
- The overlays stack. In the season, a discount popup can appear on top of a cookie banner, next to a chat bubble, under a sticky free-shipping bar. Nielsen Norman Group calls competing overlays an increasing problem, and suggests walking through your top tasks in a private browser window and counting the overlays you meet (Nielsen Norman Group, Overlay Overload).
- The offer can clash. A "10% off your first order" popup on a page that already says "30% off sitewide" raises a question: do the two stack? If the page doesn't answer it, shoppers may go looking.
So read the popup for the job it has in the season: collect sign-ups without hiding the sale or slowing the path into products.
What a heatmap can and can't show about a popup
A heatmap adds up clicks and scrolls from many visits onto one screenshot of the page. Microsoft Clarity, a free analytics tool, will draw one from any amount of traffic, for a single page or a group of pages (Microsoft Clarity, Heatmaps overview).
Overlays are the hard case. The click map ranks elements by clicks, including things that aren't links, and lets you switch to dead clicks, rage clicks, error clicks, first clicks and last clicks (Microsoft Clarity, Click maps). But the screenshot behind the map is one moment of the page, and it may not include the popup. Clarity notes that a page impression might not show the element a user actually clicked. So clicks on the popup's close button or email field can appear to land on the hero image or a product tile beneath it.
That means three tools, used together:
- The click ranking list, not the colors. Look for the popup's elements by name: the close button, the email field, the submit button, "No thanks."
- First clicks. If the popup opens on arrival, the first click map is mostly a map of how people close it.
- Session recordings. Watch the popup appear, and watch what people do next. Ten or so recordings per device will usually tell you more about an overlay than any screenshot.
The scroll map shows how far down the page people get, in 5% steps, with the average fold (Microsoft Clarity, Scroll maps). Use it to check whether visitors who saw the popup still scrolled into the products.
Set it up so the map means something
- Write down the popup's rules. Which pages it appears on, after how many seconds or how much scroll, on which devices, and how often it comes back after someone closes it. Popup apps make these easy to change and easy to forget. You can't read the map without them.
- Split by device. Read mobile and desktop separately. The same popup is a small card on desktop and a full-screen sheet on a phone. Our guide to mobile vs desktop heatmaps explains why the maps differ.
- Read one landing page at a time. A popup on the homepage, a sale landing page and a product page from a Shopping ad meets three different visitors. Start with the page that gets the most paid traffic.
- Track the popup as events. Google Analytics 4 has recommended events for sign-ups and leads, such as sign_up and generate_lead (Google Analytics, Recommended events). If your popup app sends an event when the popup opens, when it's closed and when someone signs up, you can compare what each group did next, which a heatmap alone can't show.
- Write down the one action. On a sale page, the action is still a click into the sale, not the sign-up. Judge the popup by whether it lets that happen.
- Use a fixed, long enough window. Aim for a few hundred page views per device, and keep the window the same length when you compare before and after a change. If the page is quiet, heatmaps on a low-traffic website covers what you can still learn. Before the page has traffic, our free page leak scan predicts where attention will land on the page itself. It's a prediction, not your visitors' behavior, but it shows where to look first.
Read how people close it
Start with the close. It's where most visitors interact with the popup.
How fast they close it. In recordings, note how long the popup stays open before it's dismissed. If most people close it within a second or two, before they could have read it, the popup is being treated as an obstacle. That usually points to timing: it opened before they saw anything they came for.
How they close it. Look for clicks on the close button, on "No thanks," and on the area outside the popup. Rage clicks outside the popup mean people expected a tap outside to close it and it didn't. Several clicks around a tiny close icon in the corner mean the target is too small to hit on a phone. Nielsen Norman Group recommends supporting both a clear Close button and the phone's or browser's Back button or gesture for dismissing overlays (Nielsen Norman Group, Accidental Dismissal of Overlays). Watch for visitors who press Back to close the popup and leave the site instead.
Whether it comes back. If recordings show the same visitor closing the popup on the landing page and again on a product page, the frequency rule is wrong. Once closed, it should stay closed for the visit.
Then read what it covers
Check the first screen on a phone with the popup open. Open the page on a phone, or watch a mobile recording, and note what is still visible: the offer, the end date, the shop button. If the popup hides all of it, every visitor's first impression of your sale is the popup.
Check what visitors see after closing it. Compare first clicks after the close with first clicks on the same page with the popup turned off, or from a period before it ran. If the shop button gets fewer clicks after the popup starts, the popup may be costing more than its sign-ups.
Check the overlays together. Count every layer a mobile visitor meets in the first ten seconds: cookie banner, popup, chat bubble, sticky bars. If the shop button is hidden behind a sticky bar and a chat bubble once the popup is closed, that's a layout bug the popup made visible. Our guide to a low mobile conversion rate covers more of the phone-specific causes.
Then read the sign-up itself
Clicks into the email field with few submits can mean the form asks for too much, the keyboard covers the submit button on a phone, or the offer isn't worth an email. Watch the recordings to see which.
Clicks on the discount text ("10% off your first order") that isn't a link usually mean people want the terms. If the popup's offer doesn't stack with the sale, say so in the popup. If it does, say that instead.
Error clicks after submit point to a broken form or a slow app. In the busiest week of the year, check that the popup works on the phones and browsers most of your traffic uses.
Common mistakes reading a popup heatmap
Trusting the colors. A hot spot on the hero image may really be the close button of a popup that isn't in the screenshot. Use the ranking list and recordings.
Judging the popup by sign-ups alone. A popup that collects more emails while fewer visitors click into the sale may not be a win. Look at both.
Comparing different weeks. Traffic in the week before Black Friday, on the weekend itself and in December behaves very differently. Don't compare a quiet window without the popup to a busy one with it and call the difference the popup's effect. The Black Friday post-mortem guide covers how to compare holiday periods fairly.
Forgetting search. Google's Search Central guidance says intrusive interstitials and dialogs that obstruct the page may lead to poor search performance, and recommends small banners instead of full-page interstitials (Google Search Central, Interstitials and dialogs). That matters for pages that earn search traffic, not only paid traffic.
Changing the offer, the timing and the design together. If you delay the popup, shrink it and change the discount at once, you won't know which change helped.
Turn one pattern into one change
Pick one pattern, write down what you think it means, make one change, and re-measure over a window of the same length. For example: "On mobile, the discount popup opens on arrival on the sale landing page and covers the shop button, and most visitors close it within two seconds. If we delay it until a visitor has scrolled past the first product row, clicks on Shop the sale from mobile visitors should rise over the next seven days, without a large drop in sign-ups."
Our CRO hypothesis template gives you a format for writing these down. With holiday traffic changing day to day, a clean A/B test is often out of reach, so CRO without A/B testing shows how to measure a before-and-after honestly. If you'd rather not run that re-measurement by hand, every Cortality plan re-measures each fix you ship; compare the plans.
Holiday popup heatmap checklist (copy this)
- Popup rules written down: pages, delay or scroll trigger, devices, how often it returns
- Desktop and mobile read separately
- One landing page at a time, starting with the busiest paid landing page
- Popup open, close and sign-up tracked as events
- One action written down (usually a click into the sale, not the sign-up)
- Click ranking list and first clicks read, not just the colors
- Ten or so recordings per device watched from the moment the popup opens
- Time to close noted, and close method checked: button, "No thanks," tap outside, Back
- Close target large enough on a phone, and the popup stays closed for the visit
- Offer, end date and shop button visible on a phone with the popup open, or the popup delayed
- Every overlay in the first ten seconds counted on mobile
- Popup discount terms clear: whether it stacks with the sale
- Sign-ups and clicks into the sale compared, before and after
- One change shipped, re-measured over the same window length
Where Cortality fits
Most of this comes down to one question: what do holiday visitors actually see, skip and tap on your sale page, with the popup and after it, and where do they give up? Cortality measures how real visitors use every part of your page, including the offer, the shop button and the product tiles, on each device. You get a ranked list of fixes, each with the evidence and the exact change to make, and after you ship a fix Cortality re-measures it and tells you whether it worked. It works alongside Google Analytics and Microsoft Clarity rather than replacing them. See how it works or what a finding looks like. For online stores, see Cortality for Shopify stores.
For a quick first look, our free page leak scan takes about a minute and needs no install. It's a prediction from our attention model, not data from your real visitors, so use it to decide where to look first.
Plans are $99, $249 or $499 a month (Starter, Growth and Scale). Start your free week, and you see your first report before you pay. You save a card at signup, and nothing is charged until 3 days after your first report. Cancel before then and you pay nothing, and any charge can be refunded within 14 days. How the free week works.
Questions
Can a heatmap show clicks on a popup?
Usually, but not cleanly. The clicks are recorded, but the screenshot behind the heatmap may be taken without the popup open, so clicks on the close button or the email field can appear to land on whatever sits underneath. Microsoft Clarity notes that a page impression might not show the element a user clicked. Read the click ranking list and a few session recordings alongside the map.
What does a holiday popup heatmap show?
How visitors respond to a sale or email popup: how many close it, how fast, whether they tap outside it or on a close button that is hard to hit, whether it covers the offer or the shop button on a phone, and whether visitors who close it go on to shop. On a sale page it also shows whether the popup competes with other overlays, such as a cookie banner, a chat widget or a sticky bar.
Should I turn off my popup during Black Friday?
Not by default. Check first. If recordings show most visitors closing it within a second or two, if it covers the offer or the shop button on a phone, or if it stacks with other overlays, change the timing, the size or the pages it appears on. If it collects sign-ups without those problems, keep it, and measure both the sign-ups and what happens to people who close it.
Do popups hurt SEO?
They can. Google's Search Central guidance says intrusive interstitials and dialogs that obstruct the content make it hard for search engines to understand a page and may lead to poor search performance. It recommends banners that take up a small part of the screen instead of full-page interstitials. Legally required dialogs, such as cookie consent or age checks, are treated differently.
Where does Cortality fit with a holiday popup?
Cortality measures how real visitors use each part of your page on each device, including what they see and tap once a popup is closed, ranks what to fix, and re-measures each change you ship. It works alongside Google Analytics and Microsoft Clarity rather than replacing them. The free page leak scan at /leak/ is a prediction from our attention model, not data from your real visitors.