Free Shipping Bar Heatmap: Is Your Holiday Threshold Helping or Hurting?
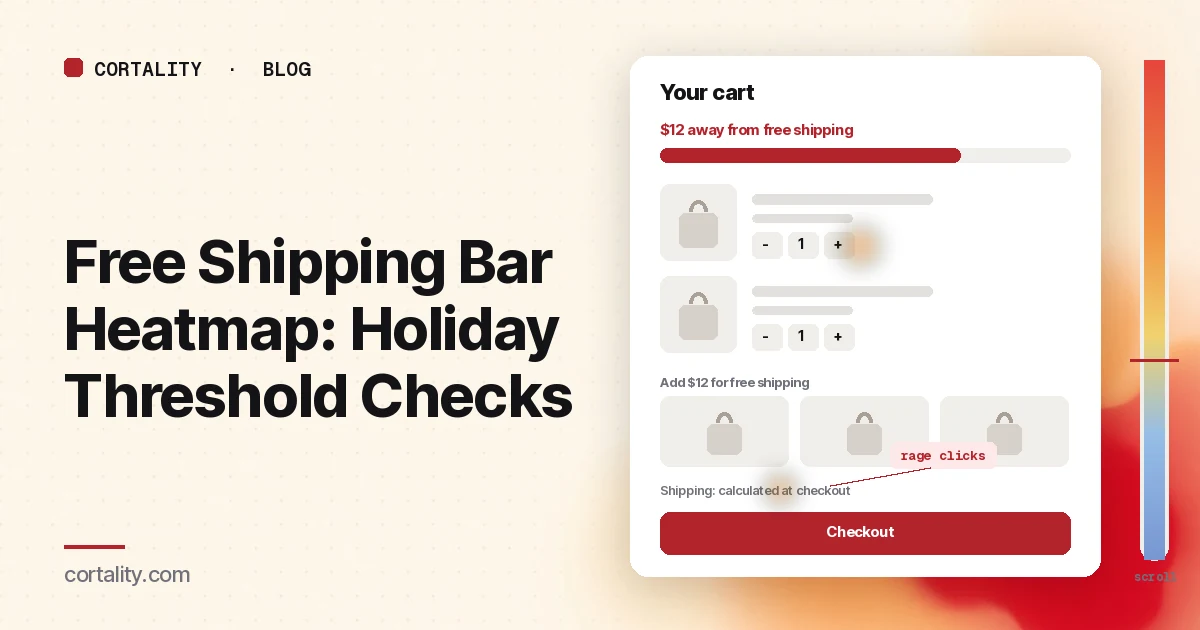
In the holiday season, almost every store tells shoppers something about shipping before they reach checkout. An announcement bar that says "Free shipping over $50," a progress bar in the cart that says "You're $12 away," a line under the price on the product page. It's one of the few messages that sits on nearly every page, and one of the few that shoppers actually came looking for.
Shipping is a reason people choose where to shop. In the National Retail Federation's holiday research this year, 37% of shoppers cited free shipping or shipping promotions as a factor in deciding which retailers to shop with during the season, after sales and discounts (56%), quality (51%) and selection (46%) (NRF, 2026 holiday shopping trends, Oct. 28, 2026). And shipping cost is a reason people leave: in Baymard's research, setting aside shoppers who were just browsing, 40% had abandoned an order because extra costs like shipping, tax and fees were too high, and 12% because they couldn't see or calculate the total up front (Baymard Institute, Cart abandonment rate, updated Oct. 28, 2026).
This guide is about reading heatmaps and session recordings of that message: what to set up, what to look at first, what the common patterns usually mean, and which change to make first. It's not advice on what your threshold should be; that depends on your margins. It's a way to find out whether the threshold you have is doing its job. For the cart page as a whole, see the cart page heatmap. For checkout settings, see Shopify checkout optimization. For the rest of the store in the holiday window, use the holiday ecommerce CRO checklist. If you're new to heatmaps, how to read a website heatmap covers the basics first.
Why the free shipping message needs its own read
A free shipping bar has one job: to tell shoppers the rule early, and to show them, in the cart, how close they are. When it works, some shoppers add one more item and the order goes through. When it doesn't, it can do the opposite.
Three things make it worth a closer look in the holiday season:
- The rule often changes. Some stores lower the threshold, or drop it, for Black Friday or the last weeks before the holiday. If the announcement bar, the product page, the cart and the checkout don't all say the same thing on the same day, shoppers notice at the worst moment.
- The threshold meets the shipping cutoff. Free shipping is often the slowest option. After your standard cutoff, a shopper who reaches the threshold may find that free shipping won't arrive in time. The bar needs to say so; our guide to holiday shipping cutoff dates covers when to change the message.
- Most of it happens on a phone. Adobe forecasts that mobile will account for 57.4% of U.S. holiday online spending this season (Adobe, 2026 holiday forecast, Sept. 28, 2026). On a phone, an announcement bar, a cookie banner and a sale popup compete for the same strip of screen, and a progress bar can push the checkout button below the first screen of the cart.
So read the message for the job it has in the season: make the rule clear, help shoppers who are close to cross it, and never make the total a surprise.
What heatmaps show about a free shipping bar
A heatmap adds up clicks and scrolls from many visits onto one screenshot of the page. Microsoft Clarity, a free analytics tool, will draw one from any amount of traffic, for a single page or a group of pages (Microsoft Clarity, Heatmaps overview).
The click map ranks elements by clicks, including things that aren't links, and lets you switch to dead clicks, rage clicks, error clicks, first clicks and last clicks. From any element you can open the session recordings behind it (Microsoft Clarity, Click maps). For a shipping bar, that tells you whether people tap it, whether they tap the add-ons beside it, and where their last click lands before they leave the cart.
The scroll map shows how far down the page people get, in 5% steps, with a drop-off view and the average fold (Microsoft Clarity, Scroll maps). In a cart, that shows whether the progress bar and any recommended items push the checkout button out of view.
The compare view puts two heatmaps side by side, for example mobile against desktop, or the cart before and after you changed the bar (Microsoft Clarity, Heatmaps compare).
A heatmap is weakest on the bar's main effect, which is on what people add to their cart. For that, pair it with analytics.
Set it up so the read means something
- List every place the message appears. Announcement bar, product page, cart page, cart drawer, checkout. Write down the exact wording in each, on the day you read the maps. Mismatches are the most common problem, and you find them before you open a heatmap.
- Split by device. Read mobile and desktop separately. Announcement bars and cart drawers behave very differently on a phone. Our guide to mobile vs desktop heatmaps explains why the maps differ.
- Know the bar's states. A progress bar usually has several messages: far from the threshold, close to it, and reached. A cart drawer opens over the page. Clarity notes that the page impression shown on a click map might not show the element a user actually clicked, so clicks in a drawer can appear on the page beneath it. Write down which state you're looking at, and open recordings when the screenshot and the ranking disagree.
- Track the cart steps in analytics. Google Analytics 4's ecommerce events include add_to_cart, remove_from_cart, view_cart and begin_checkout (Google Analytics, Measure ecommerce). With those in place, you can see how often shoppers add or remove items after viewing the cart, and how many go on to checkout.
- Write down the one action. In the cart, it's starting checkout. On other pages, the bar is information, not an action; judge it by whether shoppers who saw it behave differently in the cart.
- Use a fixed window that doesn't cross a rule change. Aim for a few hundred views per device, and keep the window the same length when you compare. Don't mix days with a $50 threshold and days with free shipping on everything. Before you have data, our free page leak scan predicts where attention will land on a page. It's a prediction, not your visitors' behavior, but it shows where to look first.
Read the announcement bar first
Expect most attention near the top of a page. In Nielsen Norman Group's eyetracking research, people spent about 57% of their page-viewing time above the fold (Nielsen Norman Group, Scrolling and Attention). An announcement bar sits in the most-viewed part of the page, but it's also the part people learn to ignore. Nielsen Norman Group's research on banner blindness found that people tend to skip content that looks like an ad, or sits where ads usually do (Nielsen Norman Group, Banner Blindness Revisited).
Check for dead clicks on the bar. Shoppers who tap "Free shipping over $50" usually want the details: does it apply to every item, every region, every shipping speed? If many taps go nowhere, link the bar to a short shipping section, or put the main condition in the bar itself.
Check for a rotating bar. A bar that cycles through three messages ("Free shipping over $50," "Holiday returns until Jan 31," "Sale ends Monday") means each shopper sees whichever one is showing when they look. Clicks on a rotating bar are hard to read on a heatmap, and the shipping message may be on screen for only a third of the time. If shipping is the message that matters most, keep it still.
Check what's covering it on a phone. In recordings, watch the first few seconds on mobile. A cookie banner or popup over the top of the page can hide the bar entirely. The holiday popup heatmap guide covers how to read stacked overlays.
Then read the cart
The cart is where the threshold does its work, or doesn't.
Look at quantity changes. A lot of quantity increases right after the cart opens can mean shoppers are testing the threshold: adding a second unit to see if shipping disappears. That's the bar working. A lot of quantity decreases or removes right after the shipping line appears often means the total was a surprise. Watch a few of each in recordings before you decide which you have.
Check the add-ons next to the bar. If the cart suggests products to "add $12 to get free shipping," look at whether shoppers click them, and whether those products cost about the amount needed. A $40 suggestion for a $12 gap isn't much help. Low clicks on suggestions that are priced well may mean they sit below the fold on a phone.
Check the order of the cart. On a phone, a progress bar, two line items and a row of suggestions can push the checkout button below the first screen. The cart page heatmap guide covers how to read whether shoppers reach it. If they don't, the bar may be costing you checkouts from shoppers who already qualified.
Look for rage clicks on the shipping line. Repeated taps on "Shipping: calculated at checkout" or on the estimated total mean shoppers want to know the number before they commit. If you can show the cost, or at least the rule, in the cart, do.
Check the "reached" state. When a shopper crosses the threshold, the bar usually changes to something like "You've got free shipping." Make sure it does, on every device, and that the shipping line in the cart agrees. A bar that says free shipping next to a cart that still shows a shipping charge is worse than no bar.
Then follow shoppers into checkout
The promise in the bar has to survive the first step of checkout.
Compare the cart and checkout totals. In your analytics, look at how many shoppers who view the cart begin checkout, and how many who begin checkout finish it. If shoppers who qualified for free shipping drop off in checkout more than others, open recordings of those sessions. Common causes: free shipping applies to only some regions or items, the free option is much slower than the cart implied, or the threshold is counted after a discount code.
Check the delivery dates next to the free option. After your standard shipping cutoff, the free option may no longer arrive by the holiday. If the checkout shows a delivery estimate, it should agree with what the bar and product page said. If it doesn't show one, say on the cart which option still arrives in time.
Read the checkout page itself. The checkout page heatmap guide covers how to read where buyers stop before paying, and Shopify checkout optimization lists the settings to check, including showing shipping cost and the threshold before checkout.
Common mistakes reading a free shipping bar
Using the heatmap to set the threshold. A heatmap can show that shoppers are close to the threshold and try to cross it. It can't tell you whether you can afford a lower one. That's a decision for your order data and margins.
Reading across a rule change. If the threshold dropped on Black Friday and came back on Tuesday, a map that covers both shows neither. Read each rule on its own window.
Counting clicks on the bar as success. A lot of taps on the announcement bar can mean interest, or confusion. Recordings tell you which.
Ignoring what happens after the bar. The bar's effect shows up in the cart and in checkout. A bar that gets attention but leaves the checkout rate unchanged hasn't done much.
Changing everything at once. If you change the wording, the threshold and the suggested products in one go, you won't know which change helped.
Turn one pattern into one change
Pick one pattern, write down what you think it means, make one change, and re-measure over a window of the same length. For example: "On mobile, many shoppers remove an item right after the cart shows 'Shipping calculated at checkout,' and few reach the checkout button below the suggestions. If we show the shipping cost and the free shipping rule in the cart and move the suggestions below the checkout button, the share of cart viewers who begin checkout should rise over the next seven days."
Our CRO hypothesis template gives you a format for writing these down. With holiday traffic changing day to day, a clean A/B test is often out of reach, so CRO without A/B testing shows how to measure a before-and-after honestly. If you'd rather not run that re-measurement by hand, every Cortality plan re-measures each fix you ship; compare the plans.
Free shipping bar heatmap checklist (copy this)
- Every place the shipping message appears listed, with today's wording
- Announcement bar, product page, cart and checkout say the same thing
- Desktop and mobile read separately
- Bar states noted: far, close, reached; cart drawer vs cart page
- add_to_cart, remove_from_cart, view_cart and begin_checkout tracked
- Reading window doesn't cross a threshold or promotion change
- Dead clicks on the announcement bar checked, conditions linked or stated
- Shipping message not hidden by a popup or cookie banner on a phone
- Rotating bar replaced by a still one if shipping is the key message
- Quantity changes and removes after the cart opens watched in recordings
- Suggested add-ons priced close to the gap, and visible on a phone
- Checkout button on the first screen of the cart on a phone
- "Reached" state matches the shipping line in the cart
- Free option's delivery date stated after the shipping cutoff
- One change shipped, re-measured over the same window length
Where Cortality fits
Most of this comes down to one question: what do holiday shoppers actually see, skip and tap around your shipping message, and do they go on to checkout or leave? Cortality measures how real visitors use every part of your page, including the shipping bar, the cart and the suggested add-ons, on each device. You get a ranked list of fixes, each with the evidence and the exact change to make, and after you ship a fix Cortality re-measures it and tells you whether it worked. It works alongside Google Analytics and Microsoft Clarity rather than replacing them. See how it works or what a finding looks like. For online stores, see Cortality for Shopify stores.
For a quick first look, our free page leak scan takes about a minute and needs no install. It's a prediction from our attention model, not data from your real visitors, so use it to decide where to look first.
Plans are $99, $249 or $499 a month (Starter, Growth and Scale). Start your free week, and you see your first report before you pay. You save a card at signup, and nothing is charged until 3 days after your first report. Cancel before then and you pay nothing, and any charge can be refunded within 14 days. How the free week works.
Questions
What does a free shipping bar heatmap show?
Where visitors click or tap around your free shipping message, how far they scroll, and which elements they click that don't respond. For a free shipping bar, that usually means whether shoppers tap the bar expecting details, whether they reach the recommended add-ons that help them cross the threshold, how often they change quantities in the cart, and whether they continue to checkout or leave once shipping appears.
Where should a free shipping bar go?
Where shoppers make the decisions it affects: near the top of the page in an announcement bar so they know the rule while browsing, and in the cart or cart drawer, close to the subtotal, so they see how far they are from the threshold. A heatmap tells you whether shoppers see and use it in each place, and recordings show whether it changes what they do.
Can a heatmap tell me what my free shipping threshold should be?
No. A heatmap can show whether shoppers notice the threshold and what they do to reach it. Setting the threshold is a business decision that depends on your margins, shipping costs and typical order values. Use your order data for that, and use the heatmap to make sure the threshold you choose is easy to see and understand.
How much traffic does a free shipping bar heatmap need?
A few hundred cart and page views per device in the window you're reading is a sensible minimum. Microsoft Clarity will draw a heatmap from any amount of traffic, but a map from a few dozen visits mostly shows those few people. For the bar itself, session recordings filtered to shoppers who reached the cart are often more useful than the heatmap alone.
Where does Cortality fit with a free shipping bar?
Cortality measures how real visitors use each part of your page, including the shipping message, the cart and the add-ons, on each device. It ranks what to fix, and re-measures each change you ship. It works alongside Google Analytics and Microsoft Clarity rather than replacing them. Before the page has traffic, the free page leak scan at /leak/ is a prediction from our attention model, not data from your real visitors.