Product Bundle Page Heatmap: Do Holiday Shoppers Understand Your Gift Sets?
For most of the year, a bundle is a small extra on a store: a starter kit, a "complete the set" offer, a value pack. In the holiday season it often becomes the product. Gift sets and bundles are easy to give, already chosen for someone else, and they show value without cutting the price of each item. The shoppers who land on these pages are comparing, often on a phone, and buying for someone whose taste they're guessing.
Value is what this season is about. In the National Retail Federation's holiday research, sales and discounts were the most cited factor in deciding where to shop (56%), followed by quality of merchandise (51%), selection (46%) and free shipping or shipping promotions (37%) (NRF, 2026 holiday shopping trends, Oct. 28, 2026). Among shoppers who said the economy would affect their holiday spending, 43% planned to shop for sales more often and 31% to comparison shop online more often (NRF, Affordability Shapes Winter Holiday Shopping, Oct. 20, 2026). And most of it happens on phones: Adobe forecasts that mobile will account for 57.4% of U.S. holiday online spending this season (Adobe, 2026 holiday forecast, Sept. 28, 2026).
This guide is about reading a heatmap of a bundle or gift set page: what to set up, what to look at first, what the common patterns usually mean, and which change to make first. It's part of our page-type series. For single product pages, see the product page heatmap. For the gift guide that often sends shoppers to sets, see the gift guide page heatmap. For the rest of the store in the holiday window, use the holiday ecommerce CRO checklist. If you're new to heatmaps, how to read a website heatmap covers the basics first.
Why the bundle page needs its own read
A bundle page looks like a product page, but it asks the shopper to understand several products at once, and often to make choices for each of them. Four questions decide whether they buy:
- What's in it? Every item, with a picture, a name and the size or amount. A shopper who can't tell what's in the box won't buy it as a gift.
- Is it worth it? The bundle price, and what the items would cost separately if that's true. Shoppers do this sum whether you show it or not.
- What do I have to choose? Sizes, shades, scents or colors for each item, or a fixed set with no choices. Each choice adds a step, and on a phone those steps stack up.
- Will it work as a gift? Gift packaging, a gift message, a gift receipt, and whether it arrives before the holiday.
If any of those answers is missing or hard to find, the shopper either leaves or goes looking for it, and both show up on a heatmap. So read the page for the job it has in the season: let a shopper see what's in the set, see the value and add it to the cart without doing their own research.
What a product bundle page heatmap shows
A heatmap adds up clicks and scrolls from many visits onto one screenshot of the page. Microsoft Clarity, a free analytics tool, will draw one from any amount of traffic, for a single page or a group of pages (Microsoft Clarity, Heatmaps overview).
The click map ranks elements by clicks, including things that aren't links, and lets you switch to dead clicks, rage clicks, error clicks, first clicks and last clicks. From any element you can open the session recordings behind it (Microsoft Clarity, Click maps). On a bundle page, that tells you which items people inspect, which options they open, and where their last click lands before they leave.
The scroll map shows how far down the page people get, in 5% steps, with a drop-off view and the average fold (Microsoft Clarity, Scroll maps). On a phone, the list of what's included and the option pickers often push the add to cart button well down the page.
The compare view puts two heatmaps side by side, for example mobile against desktop, or the page before and after you added the separate-price total (Microsoft Clarity, Heatmaps compare).
Set it up so the map means something
- Group bundles on the same template. If you sell several gift sets on one layout, read them as a group first for a stable map, then your best seller on its own.
- Split by device. Read mobile and desktop separately. Item lists, option pickers and image galleries behave very differently on a phone. Our guide to mobile vs desktop heatmaps explains why the maps differ.
- Know where people come from. A shopper from a gift guide, from a "complete the set" block on a product page, from an email and from an ad arrive with different questions. Someone coming from a single product already knows one item; someone from a gift guide may know none of them.
- Know the page's states. Choosing an option for one item may open a drawer or change the price. A "build your own bundle" page changes as items are added. Clarity notes that the page impression shown on a click map might not show the element a user actually clicked. Write down which state you're looking at, and open recordings when the screenshot and the ranking disagree.
- Track the steps in analytics. Google Analytics 4's ecommerce events include view_item, select_item, add_to_cart, remove_from_cart, view_cart and begin_checkout (Google Analytics, Measure ecommerce). Compare the bundle's add-to-cart rate with the rate at which those carts reach checkout, and watch for bundles that are added and then removed in the cart.
- Use a fixed window. Aim for a few hundred page views per device, and keep the window the same length when you compare before and after a change. Holiday traffic changes day to day, so compare like with like. If your page is quiet, heatmaps on a low-traffic website covers what you can still learn. Before you have data, our free page leak scan predicts where attention will land. It's a prediction, not your visitors' behavior, but it shows where to look first.
Read the first screen first
Expect most attention near the top. In Nielsen Norman Group's eyetracking research, people spent about 57% of their page-viewing time above the fold, about 74% in the first two screenfuls, and 81% in the first three (Nielsen Norman Group, Scrolling and Attention). On a bundle page, the first screen should answer two questions: what's in it, and what it costs.
Check that the contents are visible on the first screen. A single styled photo of a gift box looks good, but it may not show what's inside. A row of small item thumbnails or a one-line list ("Shampoo 250 ml, conditioner 250 ml, hair oil 50 ml", illustrative) next to the main image answers the first question.
Check that the price and the saving sit together. If you show a saving, show it next to the bundle price, and make sure it's true: the items should actually be sold separately at the prices you add up. A saving badge far from the price, or one that doesn't say what it's compared with, invites suspicion.
Check for a one-line gift answer. Something like "Arrives gift-boxed, add a message at checkout" answers the gift question in one sentence. Only say it if it's true; if gift wrap costs extra, say so here rather than in the cart.
Then read the clicks
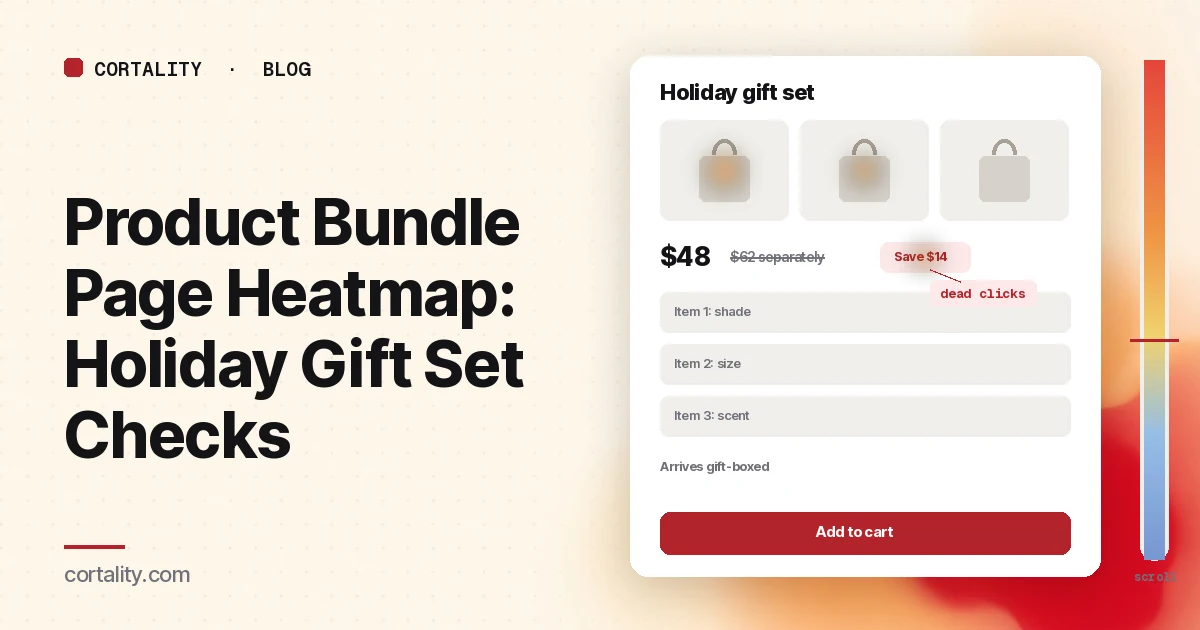
Clicks on each item thumbnail are normal and healthy: shoppers are checking what's included. Clicks on thumbnails that do nothing are dead clicks. Shoppers expect each item to open a larger view or a short description. Make them open something useful, even a small overlay with the size and what it does.
Clicks that leave for the single product pages show shoppers doing their own research, often to check reviews or add up prices. If many bundle sessions go to a single product and never return, bring the key facts onto the bundle page: size, a short description, and the separate price.
Dead clicks on the saving badge usually mean people want to know how the saving was worked out. A short "Bought separately: $X" line next to it answers that.
Clicks on option pickers that end in exits or rage clicks often point to too many choices or pickers that are hard to use on a phone. A set with four items and a shade picker for each is four decisions for someone buying for another person. If most shoppers pick the same options, consider a fixed default with a "change" link, or fewer choices in the gift version.
Clicks on "Build your own" that end before the cart mean the builder is too long or unclear about the price as items are added. Show a running total and the number of items left to choose.
First clicks on the menu, search or back button from shoppers who came from a gift guide mean the page didn't answer them quickly. The site search heatmap guide covers how to read what they search for next.
Then read the add to cart and the cart
Check that the add to cart button is on screen after the last option. On a phone, a long item list and several pickers can push it two screens down. A sticky button, or showing the options in a compact row, often helps more than a new color.
Check what shows in the cart. A bundle that appears in the cart as three unrelated lines, or with a different price from the page, causes doubt. On the cart page heatmap, look for bundle orders with clicks on the line items, quantity changes or removes. Surprises cost orders: in Baymard's research, setting aside shoppers who were just browsing, 40% had abandoned an order because extra costs were too high (Baymard Institute, Cart abandonment rate, updated Oct. 28, 2026). If gift wrap or a heavier box adds shipping, say so on the bundle page.
Check the path from product pages. If you offer the bundle as a "complete the set" block on single product pages, read that block on the product page heatmap too. A block that gets clicks but sends shoppers to a confusing bundle page costs you the single sale as well.
Then read the scroll map
After the click ranking, spend a minute with the mobile scroll map.
Note the average fold and the share of visitors who reach the item list, the price, the options, the add to cart button and the gift details. If a large share stop before the button, look at what's in between: a long story about the brand, a big lifestyle gallery, or a reviews block that looks like the end of the page.
Watch for false floors: a full-width banner, a reviews block or a strong color change that makes the page look finished. Nielsen Norman Group's research on scrolling warns that a page that looks complete can stop people from scrolling. On a bundle page, the fix is usually to move the contents, price and button up rather than to hope people scroll.
Common mistakes reading a product bundle page heatmap
Reading it against single product pages. A bundle page asks more of the shopper, so more clicks on images and options can be normal. Judge it against its own action: adding the set to the cart.
Reading a quiet window. A map from October tells you little about how the page works in the weeks before the holiday, when gift shoppers arrive from guides and emails. Read the holiday window on its own.
Showing a saving you can't back up. If the items aren't sold separately at those prices, the comparison misleads shoppers and may break pricing rules where you sell. Fix the claim before you read the map.
Changing everything at once. If you add thumbnails, cut options and move the button in one go, you won't know which change helped.
Turn one pattern into one change
Pick one pattern, write down what you think it means, make one change, and re-measure over a window of the same length. For example (illustrative): "On mobile, many bundle sessions click the item thumbnails, find nothing, and then open the single product pages, and most of those shoppers don't return to the bundle. If we make each thumbnail open a short overlay with the size, a one-line description and the separate price, the share of bundle sessions that add the set to the cart should rise over the next week."
Our CRO hypothesis template gives you a format for writing these down. With holiday traffic changing day to day, a clean A/B test is often out of reach, so CRO without A/B testing shows how to measure a before-and-after honestly. If you'd rather not run that re-measurement by hand, every Cortality plan re-measures each fix you ship; compare the plans.
Product bundle page heatmap checklist (copy this)
- Bundles on one template read as a group, best seller read on its own
- Desktop and mobile read separately
- Every way in listed: gift guide, product page block, email, ads
- Page states noted: option drawers, build-your-own steps
- One action written down (add the set to the cart)
- What's included visible on the first screen on a phone
- Bundle price and a true separate-price total side by side
- Item thumbnails open something useful
- Options cut to what a gift buyer needs, with sensible defaults
- Add to cart visible after the last option on a phone
- Bundle shows clearly in the cart, with no surprise costs
- One change shipped, re-measured over the same window length
Where Cortality fits
Most of this comes down to one question: what do holiday shoppers actually see, skip and tap on your bundle and gift set pages, and do they add the set or leave? Cortality measures how real visitors use every part of your page, including the item list, the price and saving, the option pickers and the add to cart button, on each device. You get a ranked list of fixes, each with the evidence and the exact change to make, and after you ship a fix Cortality re-measures it and tells you whether it worked. It works alongside Google Analytics and Microsoft Clarity rather than replacing them. See how it works or what a finding looks like. For online stores, see Cortality for Shopify stores.
For a quick first look, our free page leak scan takes about a minute and needs no install. It's a prediction from our attention model, not data from your real visitors, so use it to decide where to look first.
Plans are $99, $249 or $499 a month (Starter, Growth and Scale). Start your free week, and you see your first report before you pay. You save a card at signup, and nothing is charged until 3 days after your first report. Cancel before then and you pay nothing, and any charge can be refunded within 14 days. How the free week works.
Questions
What does a product bundle page heatmap show?
Where visitors click or tap on your bundle or gift set page, how far they scroll, and which elements they click that don't respond. On a bundle page that usually means whether people look at each item in the set, whether they notice the price and the saving, whether they get stuck on options such as sizes or scents for each item, and whether they click add to cart or leave.
Why do bundle pages matter more in the holiday season?
Because value drives where people shop. In the National Retail Federation's research this season, sales and discounts were the most cited factor in choosing which retailers to shop, at 56%. A bundle or gift set is one of the clearest ways to show value without a deeper discount, and it saves the shopper from choosing items one by one for someone else. That only works if the page makes the contents and the saving obvious.
Should a bundle page show the price of each item?
Usually yes, or at least the total of the items bought separately next to the bundle price, if that comparison is true and the items are sold on their own at those prices. Shoppers check whether a set is worth it. If they can't see what's included and what it would cost otherwise, many open the single product pages to add it up themselves, and some don't come back.
How much traffic does a product bundle page heatmap need?
A few hundred page views per device in the window you're reading is a sensible minimum. Microsoft Clarity will draw a heatmap from any amount of traffic, but a map from a few dozen visits mostly shows those few people. If you have several bundles on one template, read them as a group first, alongside session recordings.
Where does Cortality fit on a bundle page?
Cortality measures how real visitors use each part of your page, including the item list, the price and saving, the option pickers and the add to cart button, on each device. It ranks what to fix, and re-measures each change you ship. It works alongside Google Analytics and Microsoft Clarity rather than replacing them. Before the page has traffic, the free page leak scan at /leak/ is a prediction from our attention model, not data from your real visitors.